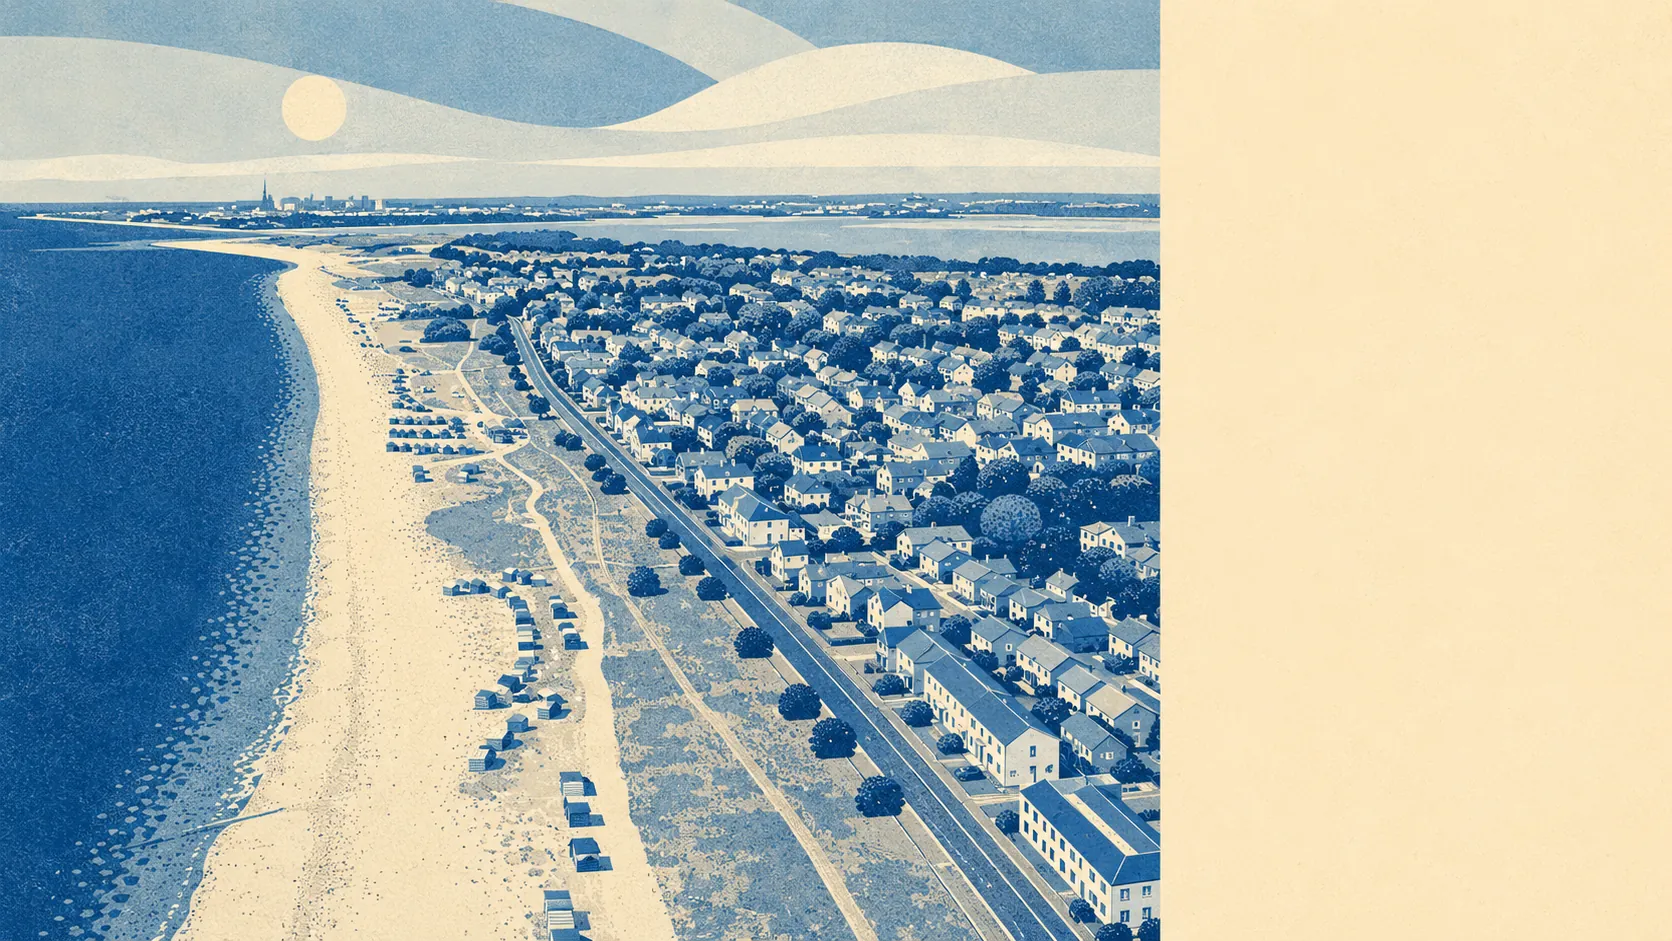
Hayling Island is partly at risk of flooding, in geographically specific patches, and the map sorts the safe postcodes from the careful ones. About one in nine postcodes sits in the higher river-and-sea flood zone. Around a third of postcodes fall inside the climate-adjusted footprint for mid-century. Roughly one in thirteen carries a high surface-water rating. The island is ringed by tidal water on every side. The question is not whether the island floods. The question is which postcode.
The Environment Agency divides river and sea flood risk into formal zones, with Zone 2 covering ground at moderate risk and Zone 3 covering ground at the highest tidal or river risk. On Hayling Island, around eleven percent of postcodes sit in Zone 3 and about four percent in Zone 2. About seven in ten postcodes sit within five hundred metres of the coast, which is the structural fact underneath the zone count. Historic flood records cover only around two percent of postcodes, which is a smaller share than the zone count suggests because zone designation describes possibility rather than the recorded past.
Surface-water flooding is the parallel picture, and on Hayling Island it does not overlap neatly with the river-and-sea picture. Around seven percent of postcodes carry a high surface-water rating, about one in ten carry a medium rating, and over a third carry a low rating. The combined high-or-medium share comes to roughly one postcode in six. Surface-water risk follows topography and drainage rather than coastal exposure, which is why the surface-water map does not match the tidal map. Both need reading together, because the postcode that escapes one can still sit inside the other.
The Environment Agency's climate-adjusted picture extends the Zone 3 footprint to around a third of the island's postcodes by mid-century. That figure is a planning projection, not a forecast, and it is the number the agency uses to scale defences rather than what insurers will price tomorrow. The shoreline-management policy for the modal stretch of the island's coast is currently to hold the existing defence line at the twenty, fifty and one-hundred year horizons. That commitment is a planning position rather than a guarantee, but it is the long-term coastal shape the public authority has chosen on paper.
Insurance cover on a property that sits inside Flood Zone 3, that carries the high surface-water rating, or both, is materially different to cover on one that sits outside both, and the difference appears at the quote stage rather than at completion. Properties with a historic flood record are flagged separately from properties that merely sit inside a zone, which means the same postcode can produce different premiums for different addresses depending on what has actually happened there. Hayling's combined exposure, a high coastal frontage on most sides and a higher-than-average surface-water signal, means the address-by-address picture matters more here than it would in a coastal village set further back from the water. A quote will usually be obtainable. The number on it is the question.
The flood risk on Hayling Island is real, geographically specific, and not uniform across the island. The maps tell different stories at different addresses, and one of them will tell the story for any given property. The buyer's job is to read both maps before reading the asking price.