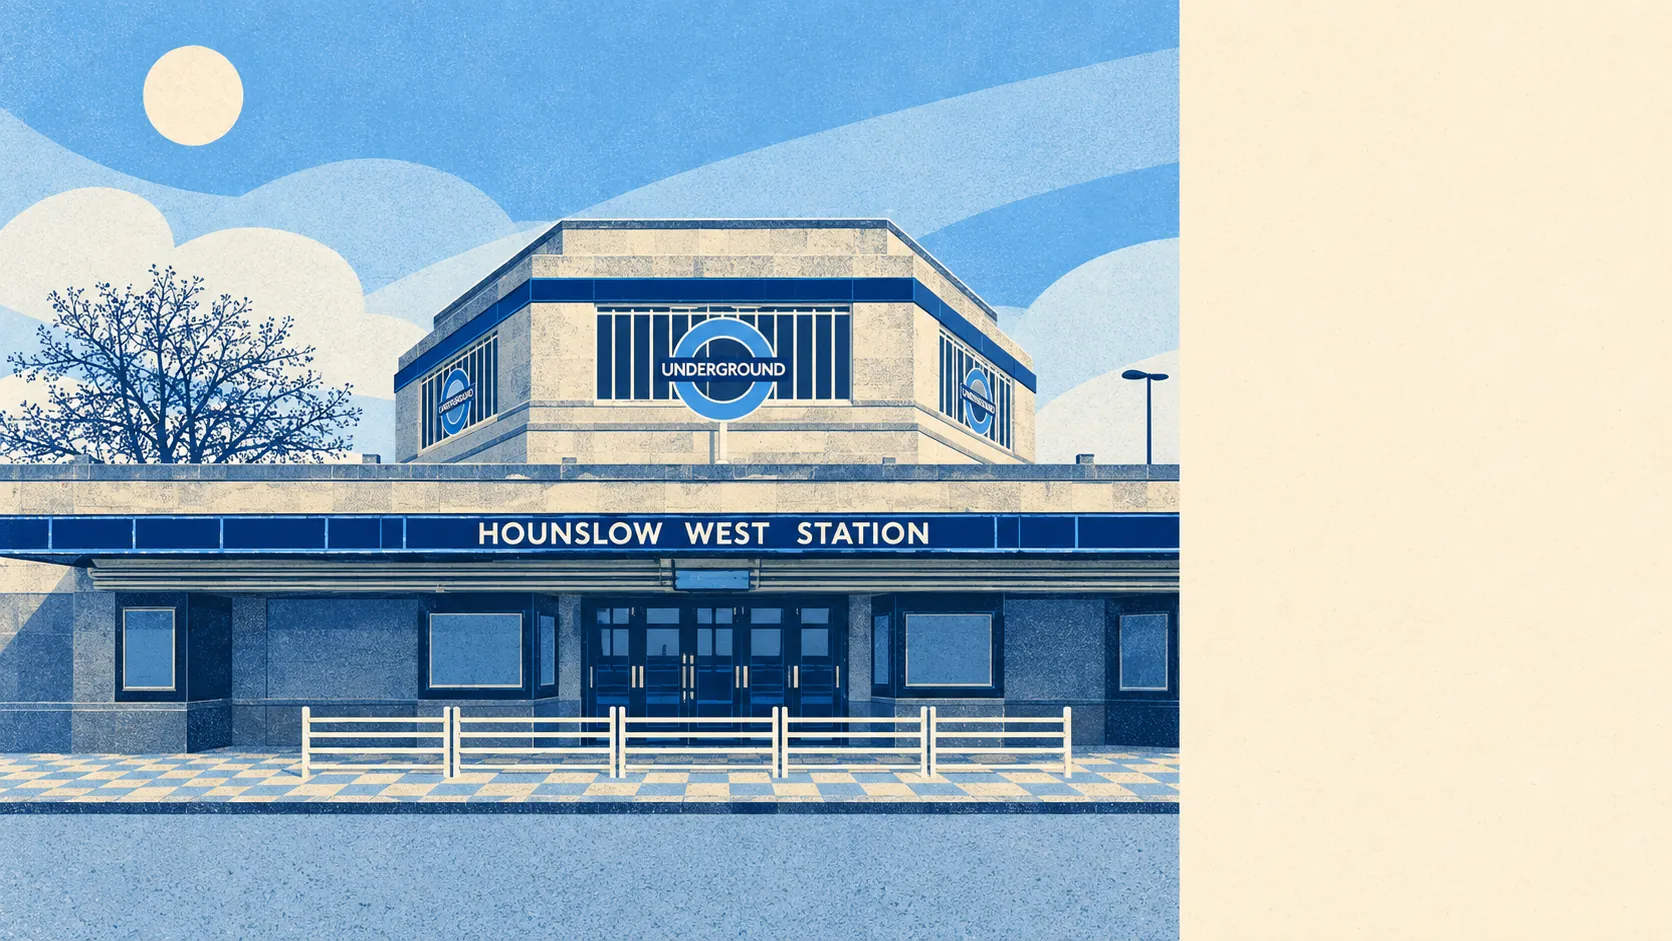
Hounslow West is an ordinary London neighbourhood for safety, just a little busier with trouble than the rest of its borough. Crime runs somewhat above the Hounslow average. Violence is a smaller share of it than nationally. Nuisance and shoplifting make up a bigger share. Most reports never end in a charge. It is a crowded corner of outer London, and its crime figures look like it.
Police.uk recorded crime in Hounslow West at about 131 per 1,000 residents in the year to May 2026, which is about 12% above the Hounslow borough average. That rate comes from 6,485 recorded crimes over the same twelve months, from June 2025 to May 2026. A full year of reports means one bad month or one busy weekend cannot swing the figure much.
For comparison, the published rate across the London Borough of Hounslow as a whole is about 117 per 1,000 over the same period. Hounslow West's 131 sits above that, though the two figures are far closer to each other than either is to a quiet market town. Buyers comparing neighbourhoods inside the borough will find the gap. Buyers comparing Hounslow with somewhere outside London are asking a different question.
The neighbourhood is dense. On average Hounslow West has about 11,400 people per square kilometre, about 22% of households count as overcrowded, and unemployment stands at about 5%. Those figures describe the setting the crime statistics come from, and none of them is offered as a cause. At that density, more people living and passing through means more reports being made.
The crime mix is more revealing than the total. Violence and sexual offences make up about 28% of Hounslow West's recorded crime, compared with about 35% across England and Wales. That category is the largest almost everywhere and includes common assault without injury, so this area's share is below the national norm. Antisocial behaviour is about 22% here against 16% nationally, and shoplifting about 11% against 8%. Other theft, at about 6% against 7%, public order offences, at about 6% against 7%, and vehicle crime, at about 6% against 5%, are all close to the national shares. The above-average categories are the ones that hit shops and street corners, and violence is the category that runs below the norm.
What happens after a report is a separate question. The Metropolitan Police Service charges a suspect in about 10% of cases, against about 12% nationally, over the twelve months to May 2026. That puts it 33rd of 42 forces in England and Wales, a league position no manager would keep their job with. About 53% of its cases close with no suspect identified. These are London-wide figures for the whole force, so they say nothing about Hounslow West's streets in particular. They answer what to expect if you ever need the police, which is a different question from how often you will need them. The police.uk street map for the exact road, read across a full year, is the most useful single check a buyer can make here.
Hounslow West is middling on safety. Its crime level is a notch above the borough, it is busy without being dangerous, and the violence share comes in under the national figure.