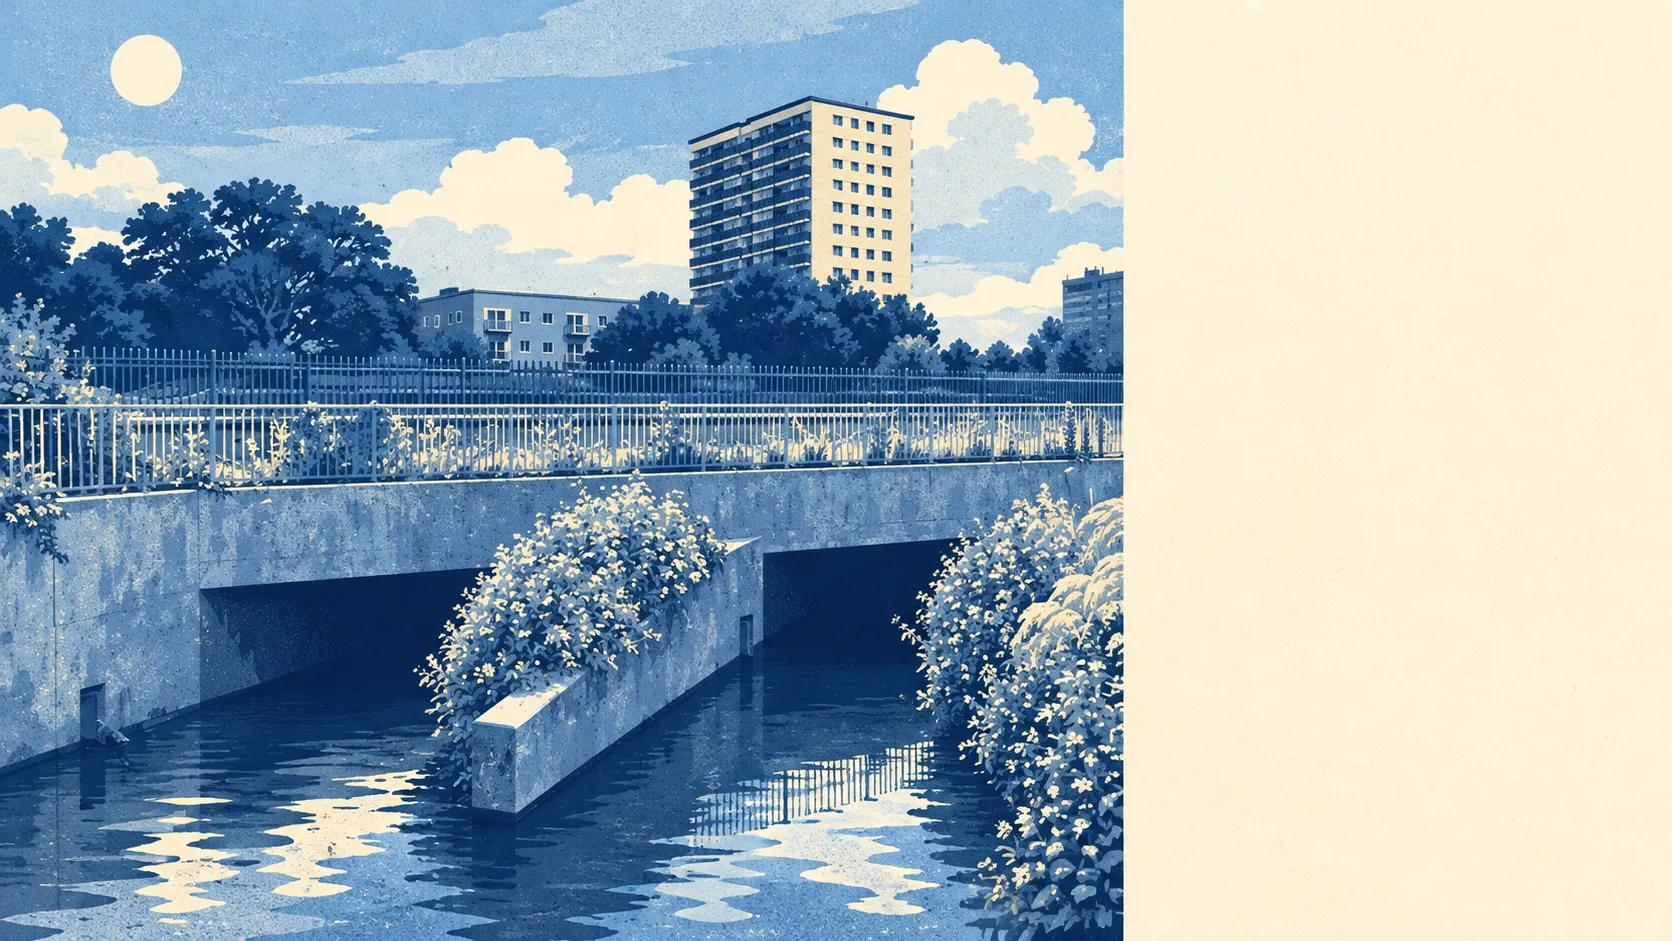
Yes, Upper Edmonton has a real flood risk. The worst of it is confined to a small part of the area, but the risk reaches further than most buyers expect. Fewer than one postcode in thirty is in the highest-risk river zone. More than a quarter are in the band just outside it. Climate allowances push that to about half. For an inland postcode on the edge of the North Circular, it is a lot of water to think about.
On the Environment Agency's river-and-sea flood zones, about 3% of Upper Edmonton's postcodes are in zone 3, the highest-probability band. A further 29% are in zone 2, the medium-probability fringe beyond it. The two bands do not overlap, so the zone 2 figure is extra ground on top of zone 3. The agency holds 23 recorded flood events for the area. The most recent was in November 2006, when a main river overtopped a channel that had no raised defences.
Surface water is a separate problem. It is rain that cannot drain away fast enough, and it can flood a street nowhere near a river. On a dense grid of terraces and hard paving, the drains do most of the work. This site folds surface water into its postcode indicators further down, so those figures cover more than the river zones.
The Environment Agency also models what the zones look like once climate change is allowed for. On that basis, about 52% of the area's postcodes fall inside a flood zone. That is a modelled scenario for planning purposes, and it is the map that councils and insurers increasingly use.
Insurance follows the maps. A home in zone 3, or one with a recorded flood against its postcode, can be harder to insure and more expensive to cover, and some insurers may exclude flooding altogether. A home in zone 2 usually gets cover without fuss, but it will be asked about. Two neighbouring terraces can get different quotes, and the price of the house won't tell you which one is the problem.
On this site's postcode indicators, any one of several measures can flag a postcode, surface water included. About 18% of Upper Edmonton's postcodes rate high on at least one of them, about 32% medium and about 62% low. Because a single measure is enough to flag a postcode, these shares are wider than the river zones. Put the exact address into the Environment Agency's long-term flood risk service, since two terraces in the same postcode can come back with different answers.
Counted as homes and other buildings, the agency's rivers-and-sea mapping finds 6,381 properties in the postcodes that carry any risk at all. Postcodes with no risk are left out of that count. Of those properties, 137 are at high risk, 710 at medium risk, 3,335 at low risk and 558 at very low risk. Counted this way, the high-risk group is small, and the low-risk group is large.
The agency's flood extent mapping puts about 2% of postcodes in the high-risk extent with no defence in the model, and about 3% in the high-risk extent with a defence modelled. "Defended" only means a defence appears in the model. It says nothing about how a wall performs on the night, and the 2006 flood came from a channel with no raised defences at all.
The nearest tide gauge to Upper Edmonton is at Portsmouth. Between 1962 and 2023 it recorded sea level rising by about 2 millimetres a year. That gauge is a long way from the North Circular, and the sea is not what threatens homes here.
Flood risk is a weakness in Upper Edmonton. Most homes face a manageable risk, while a small number face a serious one, so the exact address decides which kind of house you are buying.