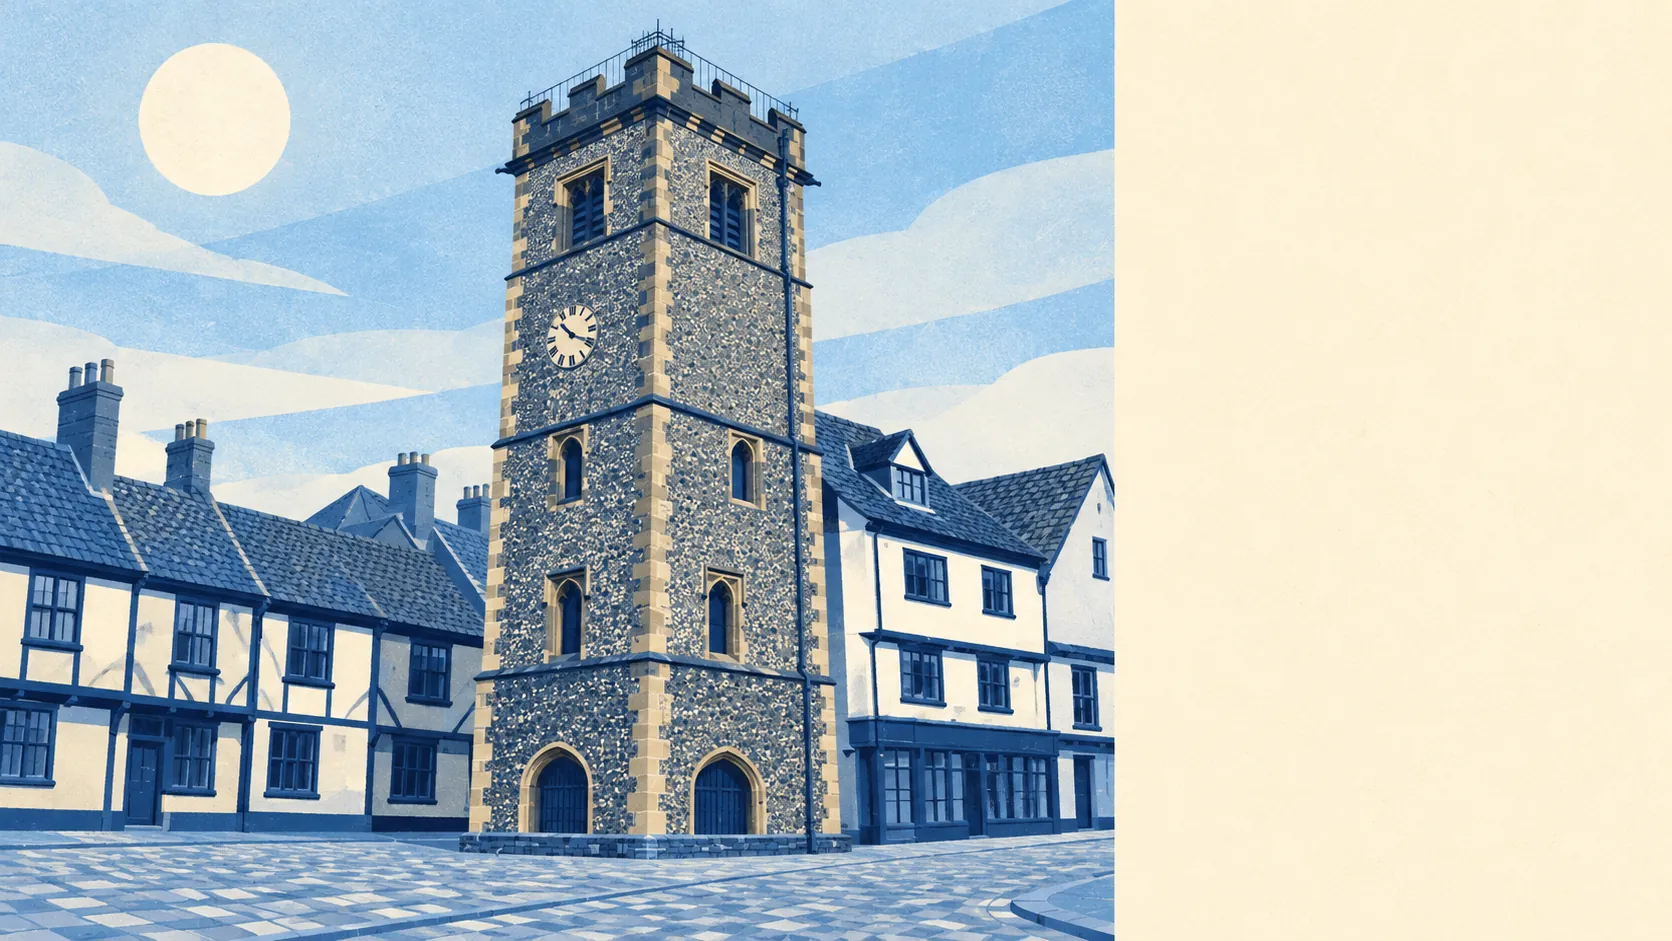
St Albans has almost no river or sea flood risk, and a patchy surface-water risk that turns up in about one postcode in ten. The rivers barely register. The rain is another matter. One flood is on record in recent years. The city's Iron Age name meant a settlement by the marsh, and the ground has not entirely forgotten.
On the Environment Agency's river-and-sea flood zones, about 0.3% of the area's postcodes are in zone 2, the medium-probability fringe, and none are in zone 3, the highest band. Zone 2 sits outside zone 3, so the small number there is the whole of it. For a city that grew up in a river valley under Roman walls, that is a remarkably dry result.
What risk there is comes mostly from surface water, where heavy rain runs off roofs, roads and slopes faster than the drains can take it. That kind of flooding does not follow a river line on a map. It picks out dips, underpasses and the low end of sloping streets.
The Environment Agency's climate-change version of the zones, which models higher river flows in future, puts about 0.6% of postcodes inside the flood zone. That is a small step up from today, on a modelled scenario, and still a small share of the city.
For most addresses here, flood risk is unlikely to drive the insurance quote. The exceptions are homes on a surface-water flow path or in the few postcodes near the river zones, where an insurer will look harder. Asking for a quote on the specific address early in the process costs nothing and settles the question in a way the sales talk never will.
A broader postcode measure counts a postcode if it rates high on any one of several flood indicators, surface water included. On that basis about 10% of postcodes in St Albans rate high on at least one measure, about 12% medium and about 29% low. Because it takes the worst of several measures, this figure runs well above the river-and-sea zones, and the two describe different things.
Counting homes gives a sharper picture. The Environment Agency's rivers-and-sea mapping lists 285 properties across the 17 postcodes in the area that carry any river risk at all. Of those, six properties are at high risk, three of them homes, one is at medium risk, 61 at low risk and 14 at very low risk. Postcodes with no river risk do not appear in that list, which is why it is so short.
On the high-probability river flood extents, no postcodes fall inside the zone either with or without defences in the model, and about 0.3% fall inside the low-probability extent with no defence modelled. A defence in the model means something is there, which is different from a promise that the water stays out. In St Albans the question mostly does not arise, because so little lies in the path of the river to begin with.
The nearest tide gauge is at Portsmouth, where sea level rose about 2 millimetres a year between 1962 and 2023. St Albans is a long way inland and uphill, so that is a fact about Portsmouth.
The Environment Agency's historic flood outlines cover none of the area's postcodes. Its recorded-events list does carry one flood, in June 2020, when a main river ran over its banks where there were no raised defences. A clean history map is reassuring, though it only shows what someone mapped.
Flood risk in St Albans is middling, and comes almost entirely from rain on the wrong streets. The rivers themselves are rarely the problem.