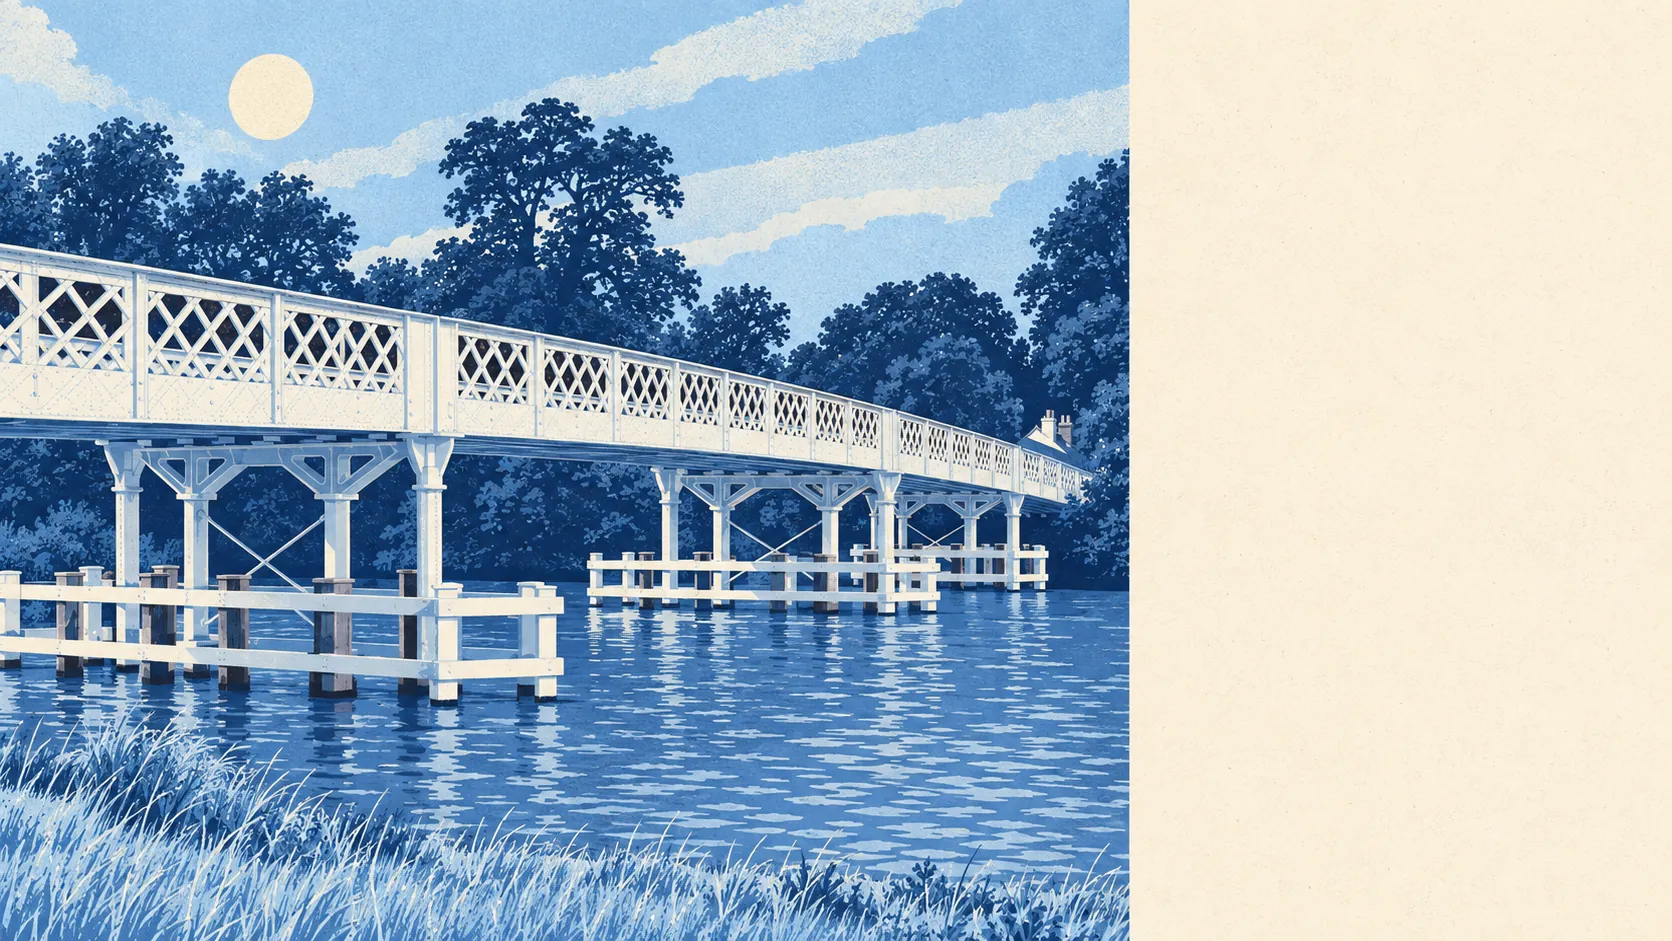
Yes, Pangbourne has a real flood risk, and it sits where two rivers meet. About one postcode in eight is at high risk on at least one measure. Six in a hundred sit in the highest-risk river zone. Allow for climate change and the flood zones take in about half the village. The meadows were flood plain long before anyone put them on a brochure.
In the Environment Agency's river-and-sea flood zones, about 12% of Pangbourne's postcodes fall in flood zone 2 and about 6% in flood zone 3. The two zones don't overlap. Flood zone 3 carries the highest probability of flooding, and flood zone 2 is the medium-probability band around it, which is why zone 2 can hold more postcodes than zone 3. The River Pang runs through the middle of the village and joins the Thames between Whitchurch Lock and Whitchurch Bridge. About 17% of postcodes have a recorded history of flooding. The Environment Agency has logged 33 recorded flood events here, the most recent in July 2007, when a main river overtopped its channel where there were no raised defences.
This page has no separate surface-water figure for Pangbourne. Rainwater that can't drain away is included in the postcode measure below, alongside rivers and sea, and it does not appear in the flood-zone shares above. The flood zones only cover water arriving from a river. They don't account for a blocked drain.
The Environment Agency's climate-adjusted mapping puts about 49% of postcodes inside the flood zones once future change is allowed for. That is a planning allowance, not a forecast of next winter. It is still the number that decides what gets built here, and the one a buyer on a long mortgage should look at.
For insurance, a home in or near the higher-risk zones can cost more to cover, or come with a bigger excess, and the premium depends on the exact address, not on the village as a whole. Insurers look up the postcode long before anyone at the insurer reads the listing. Anyone buying near the water should get a quote before instructing a solicitor, not after the survey is paid for.
On the broader postcode measure, which folds surface water in alongside rivers and sea, about 13% of postcodes rate high on at least one measure, 13% medium on at least one and 27% low on at least one. These bands overlap with the flood-zone figures above and use a different method, so they should not be added to them. The two measures answer different questions, and an estate agent will usually quote whichever one sounds better.
Counted as properties rather than postcodes, the Environment Agency's rivers-and-sea mapping lists 473 properties at some level of risk. Of those, 36 are at high risk, including 24 homes, 26 are at medium risk, 128 at low risk and 3 at very low risk. Only postcodes carrying some risk appear in this count, so homes outside them are not included. A count of houses is more useful than a share of postcodes, because a buyer lives in a house, not in a percentage.
Of postcodes inside the high-risk modelled flood extent, about 6% show no defence in the model and about 5% show one. Here "defended" means a defence appears in the Environment Agency's model. It does not mean the house stays dry, and a defence that exists on a map still has to hold on the day. The most recent recorded flood came from a stretch with no raised defences at all.
The nearest tide gauge, at Portsmouth, recorded sea level rising at about 2 millimetres a year between 1962 and 2023. That is a measured historic rate at the coast, a long way downstream of Pangbourne. The risk here comes from the rivers.
Flood risk is a weak point for Pangbourne. Most homes sit clear of the water, but the ones that don't need checking address by address before anyone signs.