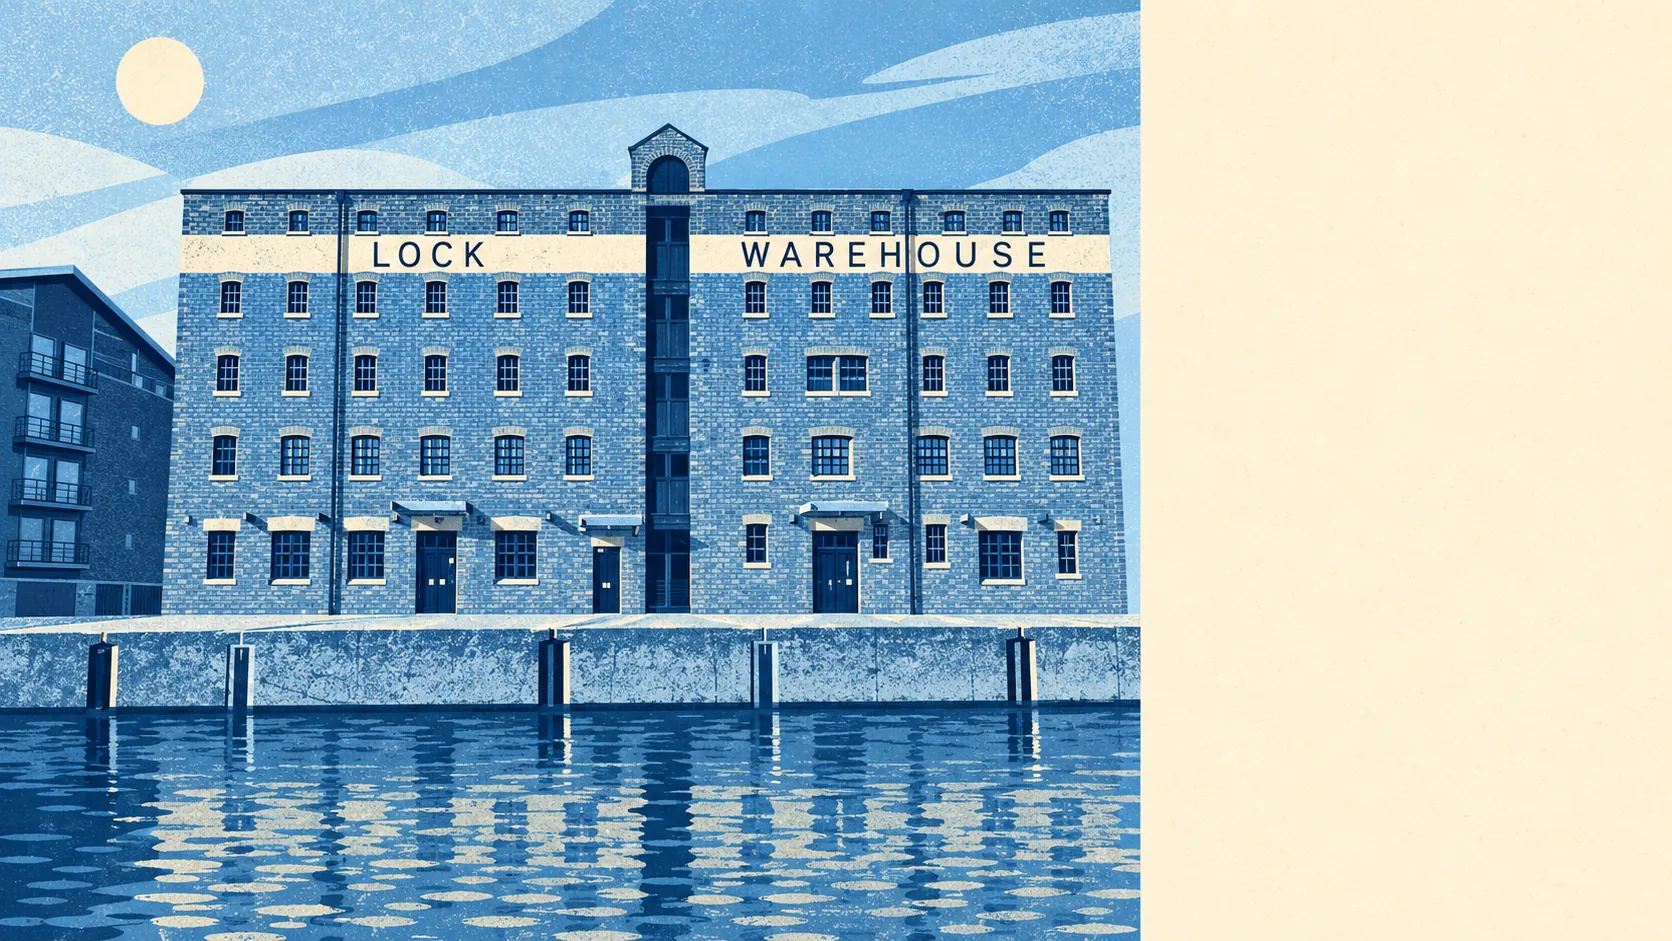
Yes, Gloucester has a real flood risk, and most of it comes down as rain, not up from the Severn. Only a small part of the city is in the river's highest-risk zone. Nearly three in ten postcodes rate high on at least one flood measure. Hundreds of homes are at high risk from the river itself. People blame the Severn, but the drains take most of the water.
Among the city's postcodes, about 4% are in Flood Zone 3 of the Environment Agency's river-and-sea mapping, the highest-probability band. Another 7% are in Flood Zone 2, the medium-probability band beyond it. The two zones do not overlap, so the second figure is added to the first and does not include it. The Environment Agency's historic flood map covers about 6% of the area, and it holds 281 recorded flood events, the most recent from the main river in July 2007. Gloucester Docks mark the normal tidal limit of the Severn, which shows how far the sea's influence reaches inland.
The river zones say nothing about rain that has nowhere to drain. Surface-water flooding is mapped separately and turns up across the city, including streets well away from the Severn and the canal. It is counted in the postcode-level figures further down.
With the Environment Agency's climate allowance applied, the flood zones grow to cover about 8% of the area. That is the modelled extent under a future climate, and the boundary on today's map will not stay where it is.
For insurers, a postcode with any recorded risk is a different proposition from one with none, and they check surface water as well as the river. A house in Hempsted or near the docks can get a very different quote from one up the hill in Tuffley. "Waterside" is the word that sells a flat at the docks, and it is also the first word an underwriter reads.
The wider measure counts a postcode if it rates on any one of several measures, including surface water, rivers and the sea. On that basis, about 29% of Gloucester's postcodes are at high risk, 34% at medium risk and 54% at low risk. The bands overlap because a postcode can carry one rating on one measure and a different rating on another. The 4% figure covers rivers and the sea, and the 29% figure takes in rain as well.
Counted as homes and other buildings, the Environment Agency's rivers-and-sea mapping lists 11,159 properties in the postcodes that carry some risk. Of those, 686 are at high risk, 2,412 at medium risk, 1,662 at low risk and 13 at very low risk. Postcodes with no river or sea risk are left out of the count altogether. The Environment Agency's long-term flood risk service will show the exact address with surface water included, and the result for one house can differ from its neighbour's.
About 1% of the city's postcodes are inside the high-probability flood extent with no defence in the model, and about 2% are inside it with a defence modelled. A defence in the model means a wall or bank exists on the map. It does not mean the water stops there, and those postcodes are still inside the extent.
The Environment Agency's tidal mapping draws its coastline up the Severn, so some Gloucester postcodes count as close to the coast. About 8% are within 500 metres of the coastline as the data defines it, the nearest is 15 metres away, and the median postcode is about 2.2 kilometres from it.
The shoreline management plan for this stretch says hold the line over 20, 50 and 100 years. That is a statement of what the authorities intend to do. It depends on funding that has not yet been committed, and it says nothing about which defences are standing today.
The nearest tide gauge with a long record is at Portsmouth, which recorded sea levels rising by about 2 millimetres a year between 1962 and 2023. That rate is measured on the south coast, a long way from the Severn's tidal reaches.
Flood risk is one of Gloucester's weaker points. The river affects a small corner of the city, but surface water reaches far more streets, and homes away from the Severn are not automatically safe.