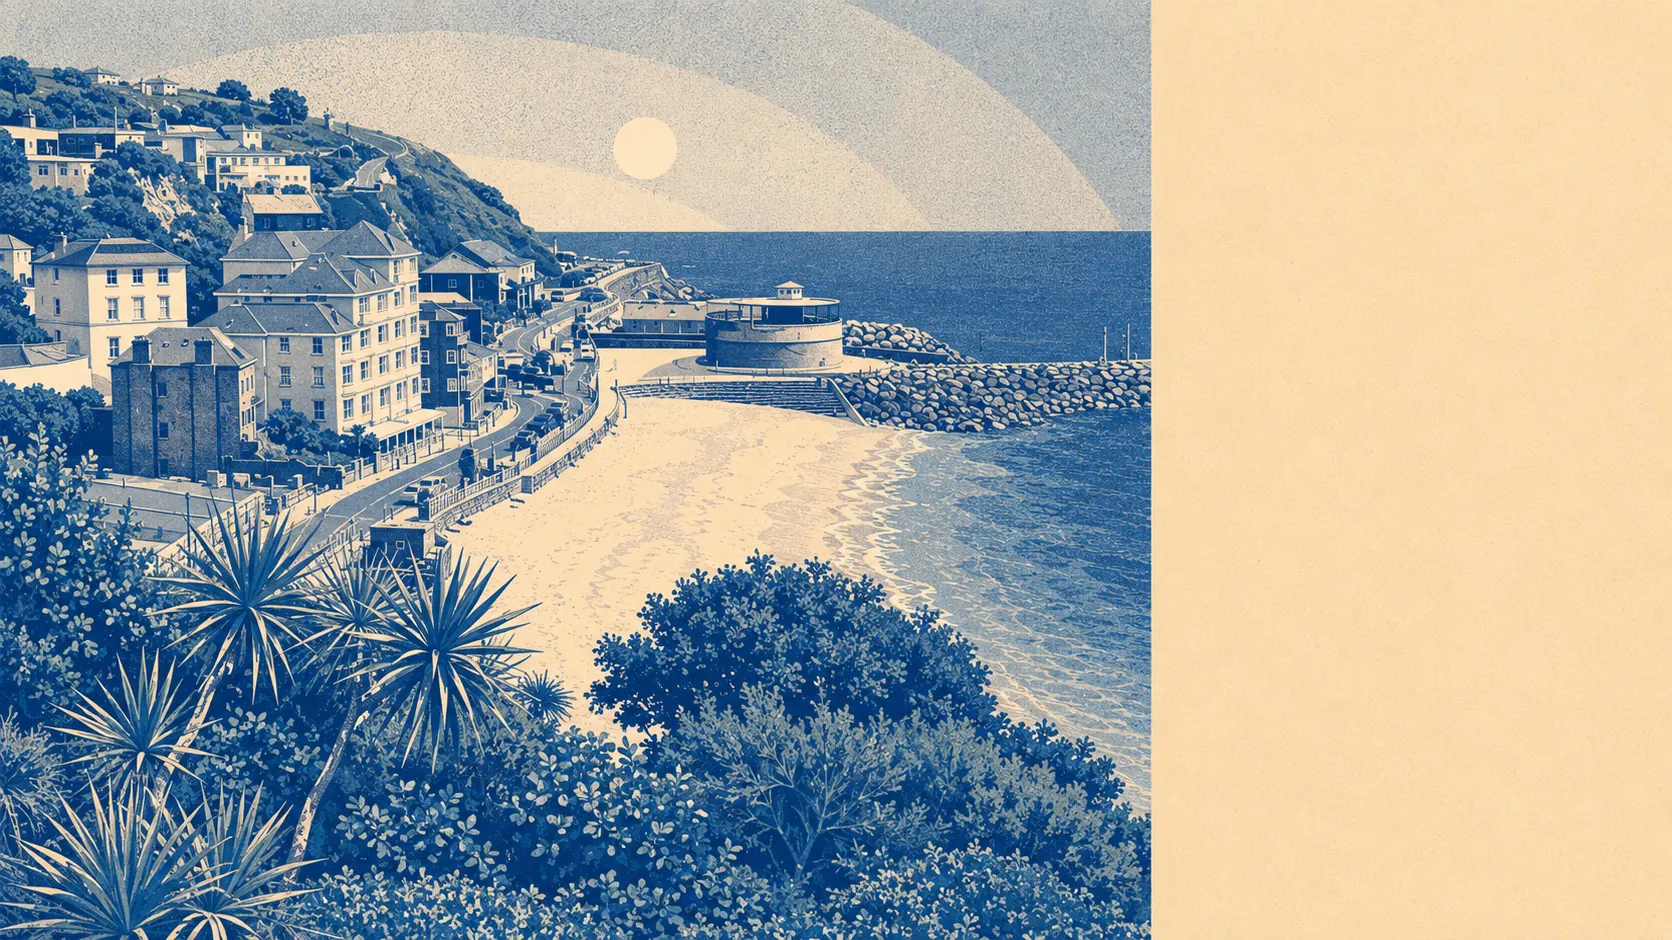
The danger is rain coming down the cliff, not waves coming up it. About one postcode in twelve carries a high surface-water flag. A further six percent sit at medium. The river and tidal flood zones come in at zero. Not a Severn-side risk profile. A cliff-side one.
River and tidal flooding is a non-event in the data. The flood zone two and flood zone three shares are both zero percent of the area. There's no river running through the town, only tufa-depositing springs feeding short streams that reach the sea before they can pool, and the historic flood record for the area also returns zero. A town built on Victorian terraces stepping down a south-facing slope doesn't accumulate the standing river water that flat downstream towns do. The water moves quickly because the geography insists.
Surface water is the active risk. Around eight percent of postcodes have at least one address flagged at high surface-water flood risk. Another six percent sit at medium. About one in six sit at low. The high-risk pockets concentrate where the slope geometry funnels rain along defined channels in heavy storms, which means a small number of streets do most of the worrying while the majority of the town stays dry. A buyer should check the specific postcode rather than the headline. The headline reads moderate. The postcode picture varies from negligible to actively significant.
The climate-adjusted flood zone share is the same as the current one: zero percent. The forward modelling doesn't lift the river or tidal zone shares above zero, because there's nothing to lift them from. What changes with climate is the coastline. Sea level at the Portsmouth tide gauge, with records running from 1962 to 2023, has been rising at about two millimetres a year, and the entirety of the area sits under a Shoreline Management Plan with a Hold The Line policy across the twenty, fifty and hundred-year horizons. The first pier was washed away by storms in the nineteenth century. The second was repeatedly damaged and finally dismantled in the 1990s. The Channel has form on this stretch of coast.
For insurance, the picture reads moderate rather than benign or catastrophic. Zero river and tidal exposure keeps the worst surcharges off the table, but a surface-water flag is a flag, and an insurer's view of a clifftop coastal town under active shoreline management will load the specific postcode rather than ignore it. Cover is available; the cheapest cover may not be. Properties on the seafront edge or at the bottom of a natural drainage channel will pay more than properties on the higher terraces, and that gap grows in line with the climate models rather than the historical record.
A moderate-risk town with a specific risk profile rather than a general one. The headline reads calm. The map decides whether that applies to a given house.