Yes, in parts. Very few homes are in the highest-risk river zone. More than a third of the town is in the medium-risk fringe around it. Allow for climate change and the modelled flood area covers almost all of it. Sunbury isn't a town where flooding happens every winter, but most buyers here should check the flood maps.
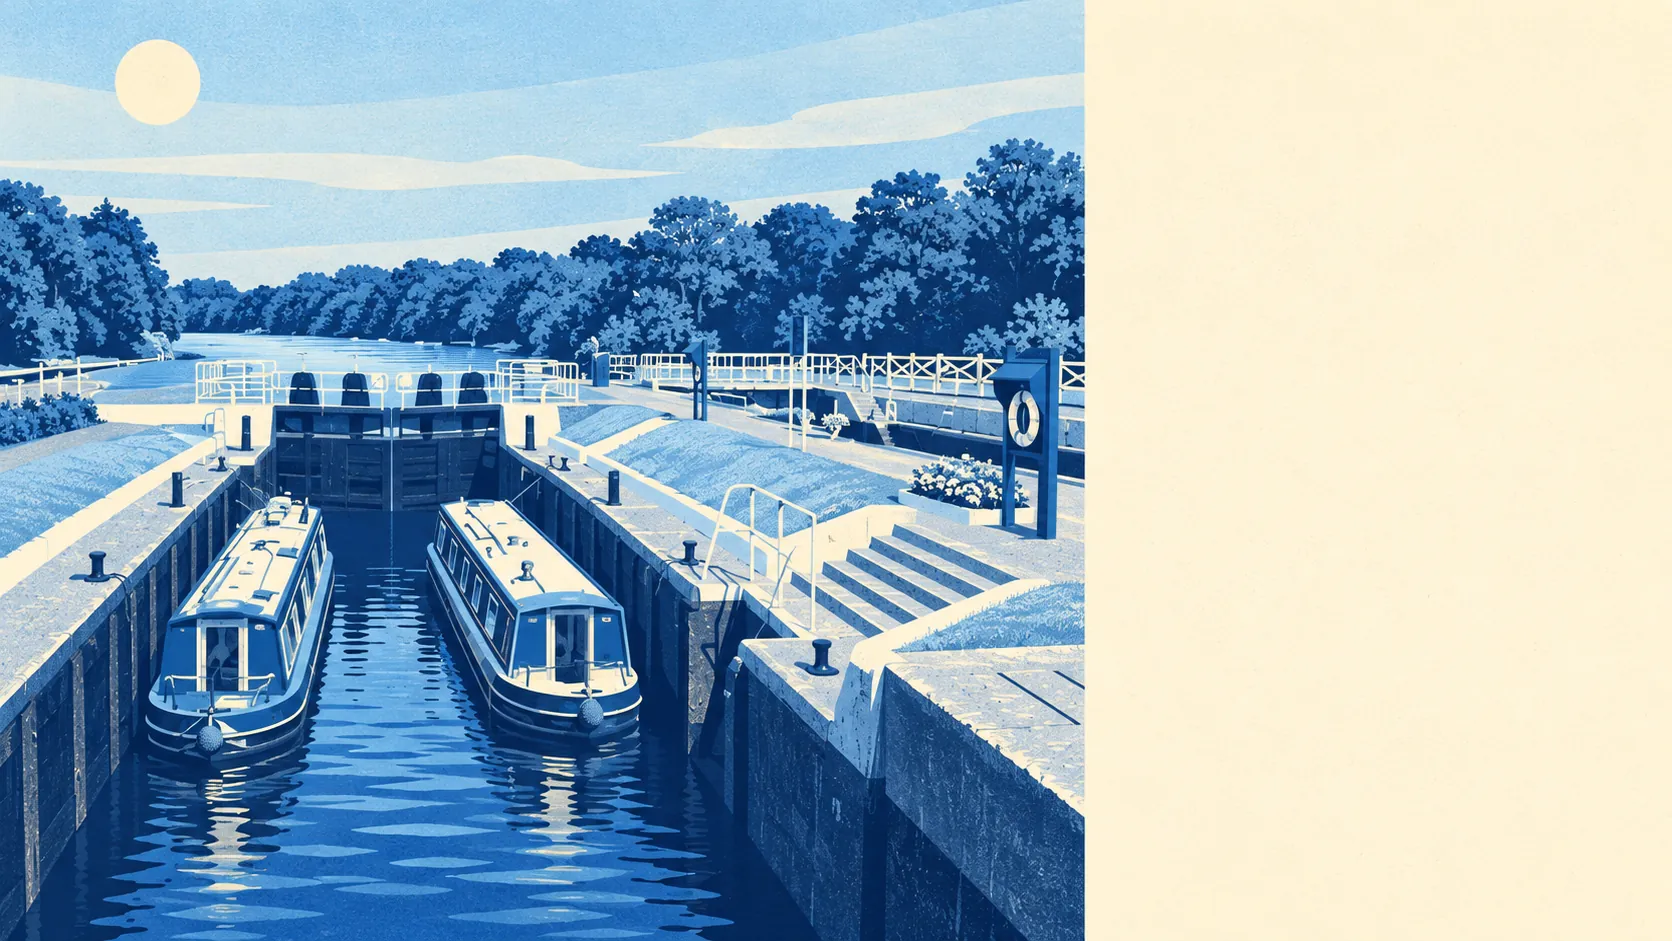
The Environment Agency's river-and-sea mapping puts about 4% of Sunbury's postcodes in flood zone 3, the highest-probability band, and about 38% in flood zone 2. The two bands don't overlap. Zone 2 is the medium-probability fringe beyond zone 3, which is why it can be the larger figure here. The Thames runs along the whole southern edge of the town. The Environment Agency owns and maintains the main weir at Sunbury Lock Ait, and it also produces the map that shows how far the river could reach.
There isn't a separate surface-water figure for Sunbury. Surface water is folded into the postcode-level measure further down this page, alongside rivers and sea.
The Environment Agency also models how the flood zones grow as the climate changes. On that climate-adjusted map, about 99% of Sunbury's postcodes are inside the zone. That shows what the modelled flood area does under climate change. It doesn't predict that any particular street will flood.
For insurance, a home in zone 2 or 3 usually means more questions from insurers and a higher premium. Some insurers will decline the closer it is to the river. Get a buildings-insurance quote on the exact address while the survey is under way, because the insurer's answer will tell you more than any town-wide figure.
Postcode by postcode, about 8% of Sunbury's postcodes are high-risk on at least one flood measure, rivers, sea and surface water included. Another 11% are medium-risk and 46% are low-risk on at least one measure. These bands overlap with the zone figures above and measure something different, so the two sets can't be added together.
Counting individual properties is the more useful measure. The Environment Agency's rivers-and-sea assessment covers 5,716 properties in the postcodes that carry any risk at all. Of those, 293 are rated high-risk, 51 medium, 820 low and 3,114 very low. Postcodes with no river or sea risk don't appear in that count. The Environment Agency has 46 recorded flood events in the area, the most recent in February 2014.
On the high-risk modelled extent, about 4% of postcodes fall inside it whether defences are included or not. "Defended" only means the model includes a defence. It doesn't mean a house is protected, and in Sunbury, including the defences hardly changes the high-risk share. The low-risk extent, without defences, covers about 47% of postcodes. A seller who describes a house as "defended" is repeating a modelling assumption, and it doesn't protect the house.
The nearest tide gauge is at Portsmouth, where sea level rose by about 2 millimetres a year between 1962 and 2023. That rate was measured on the coast, a long way from a stretch of the Thames this far inland, so it says very little about a house in Sunbury.
Flood risk in Sunbury is middling. Very few homes face high river risk, but enough are in the medium-risk fringe that most buyers should look up the flood rating for the exact address.