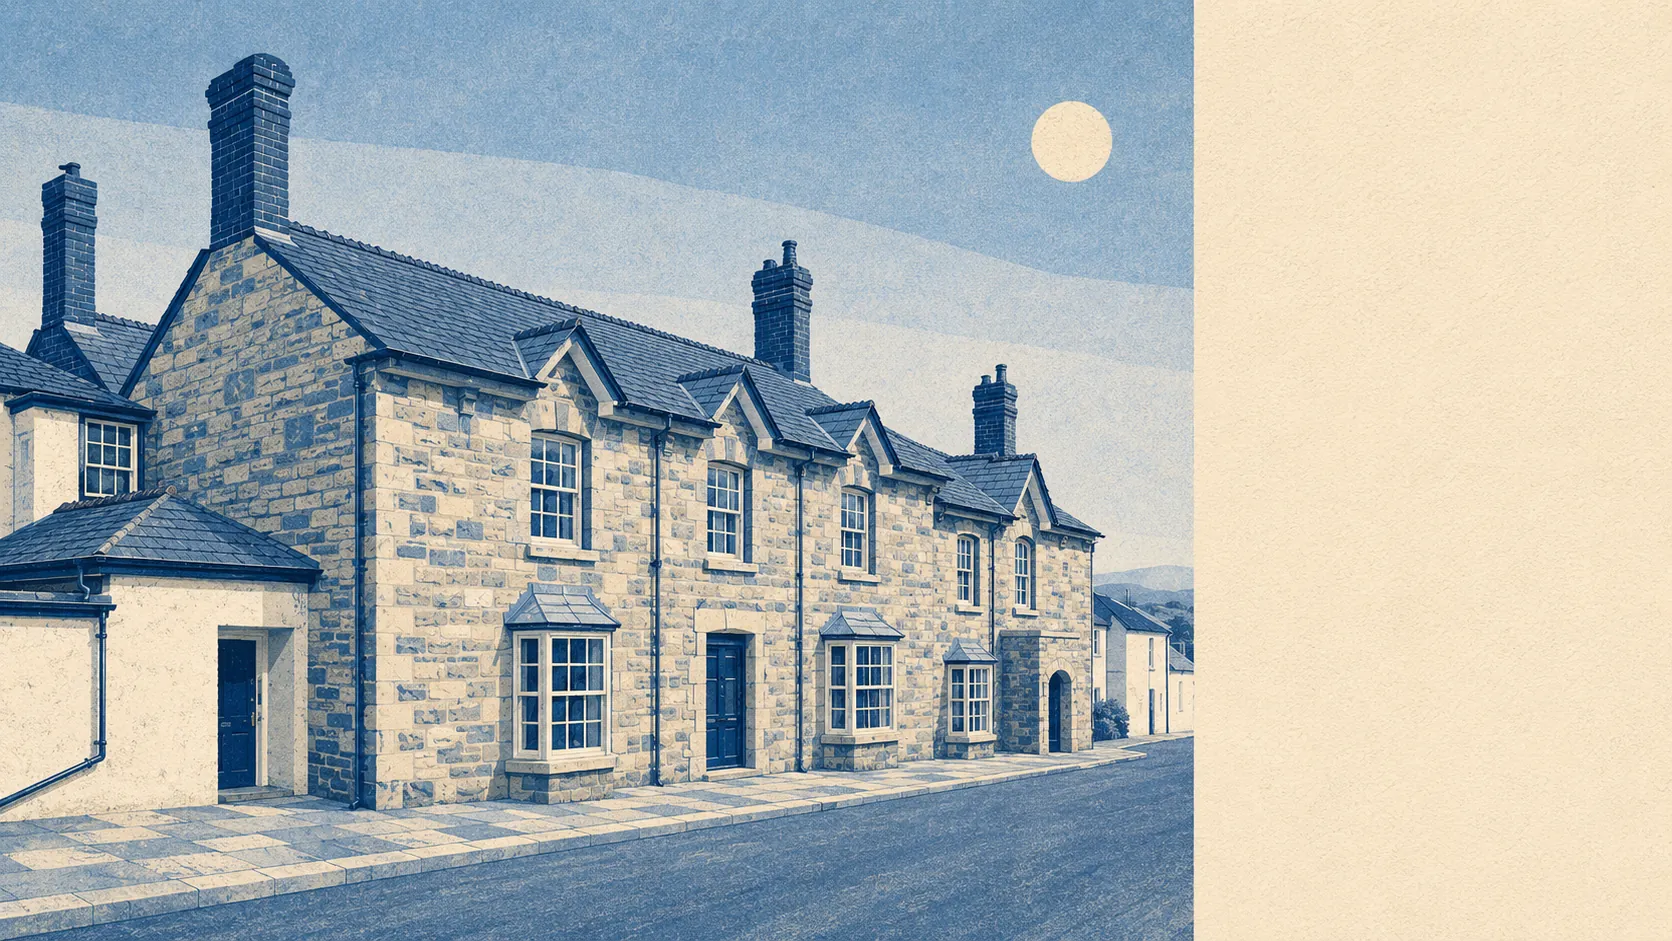
Yes, in places, and the places are what matter. Two rivers meet at the edge of the village. Around one postcode in six rates high on at least one flood measure. Most of Lifton sits well outside the river-and-sea flood zones. Flood risk here is an address question wearing a village's name, and buyers who ask it about the village rather than the house are the ones who get surprised.
Start with rivers and the sea, because that is the mapping conveyancers reach for first. The Environment Agency puts 2% of Lifton's postcodes inside flood zone 3, the highest-probability band, and 4% inside flood zone 2. Those two are separate bands rather than nested ones: zone 2 is the additional medium-probability fringe sitting beyond zone 3, which is why it can be the larger figure without meaning anything sinister. Between them, the great majority of the village is outside both.
Those zones say nothing at all about surface water, which is the type of flooding that arrives off a saturated field, down a lane and through a garden without ever troubling a river gauge. It is mapped separately, and it is folded into the postcode-level indicator set covered further down. In a valley village surrounded by farmland, it is the one worth asking about specifically, because it does not respect the boundary lines on the river map.
Looking forward rather than back, the Environment Agency also models the zones with a climate-change allowance applied. On that basis the share of Lifton postcodes inside a flood zone rises to 14%, which is close to one in seven. That is a modelled projection rather than a current designation, and it is the figure a lender or an insurer is increasingly likely to be looking at over the life of a mortgage.
For insurance, the practical consequence is that cover here is an address-by-address conversation rather than a postcode-wide one. A property outside the zones should attract ordinary terms. One inside them may attract a higher excess specifically for flood, a loaded premium, or questions about previous claims. The Flood Re scheme exists to make cover obtainable for higher-risk homes, but it does not cover properties built since 2009, so a recently built house in a risk area does not have that backstop. Get an indicative quote on the actual address before instructing a solicitor, not after.
Widening from the river zones to every flood indicator, including surface water, the screening covers 48 Lifton postcodes. Of those, 17% carry a high rating on at least one measure, 15% carry medium and 42% carry low. Those bands overlap with the flood-zone shares rather than sitting alongside them, so they cannot be added together. They are a broader net catching more water sources, which is exactly why the numbers run higher.
Counting homes rather than postcodes sharpens it considerably. Across the postcodes that carry any risk at all, the Environment Agency's rivers-and-sea mapping identifies 205 properties, of which 21 sit at high risk, 17 at medium, 51 at low and one at very low. Six of the high-risk properties are residential. Postcodes with no risk do not appear in that count at all, so this is the affected corner of the village described in full rather than the village averaged out.
On whether anything stands between the water and the house, the modelled extents put 2% of postcodes inside a high-risk area with no defence present and 2% inside a high-risk area with a defence present in the model. A further 4% sit in a low-risk undefended extent. Defended is a modelling label meaning a structure exists in the dataset. It is not a guarantee, it is not a maintenance record, and it should not be read as the reassuring half of that sentence.
The nearest long tide record is Devonport, where the gauge measured sea level rising by around 2.35 millimetres a year across its 1962 to 2015 record. Lifton is inland, so that figure is context for the wider coast rather than a direct threat to the Lyd, but it is the measured historic rate rather than anyone's forecast.
One genuinely encouraging point: no historic flooding is recorded across the area in the dataset. That is worth having. It is not proof that water has never come up, only that nothing has been logged, and an absence of records in a small rural parish is weaker evidence than an absence of records in a town.
Flooding is the weakest part of the case for living here, and it is the one part where the village average actively misleads. Get the specific address checked in the Environment Agency's long-term flood-risk tool before anything else, because the gap between a safe Lifton postcode and a risky one is wider than the gap between Lifton and anywhere else.