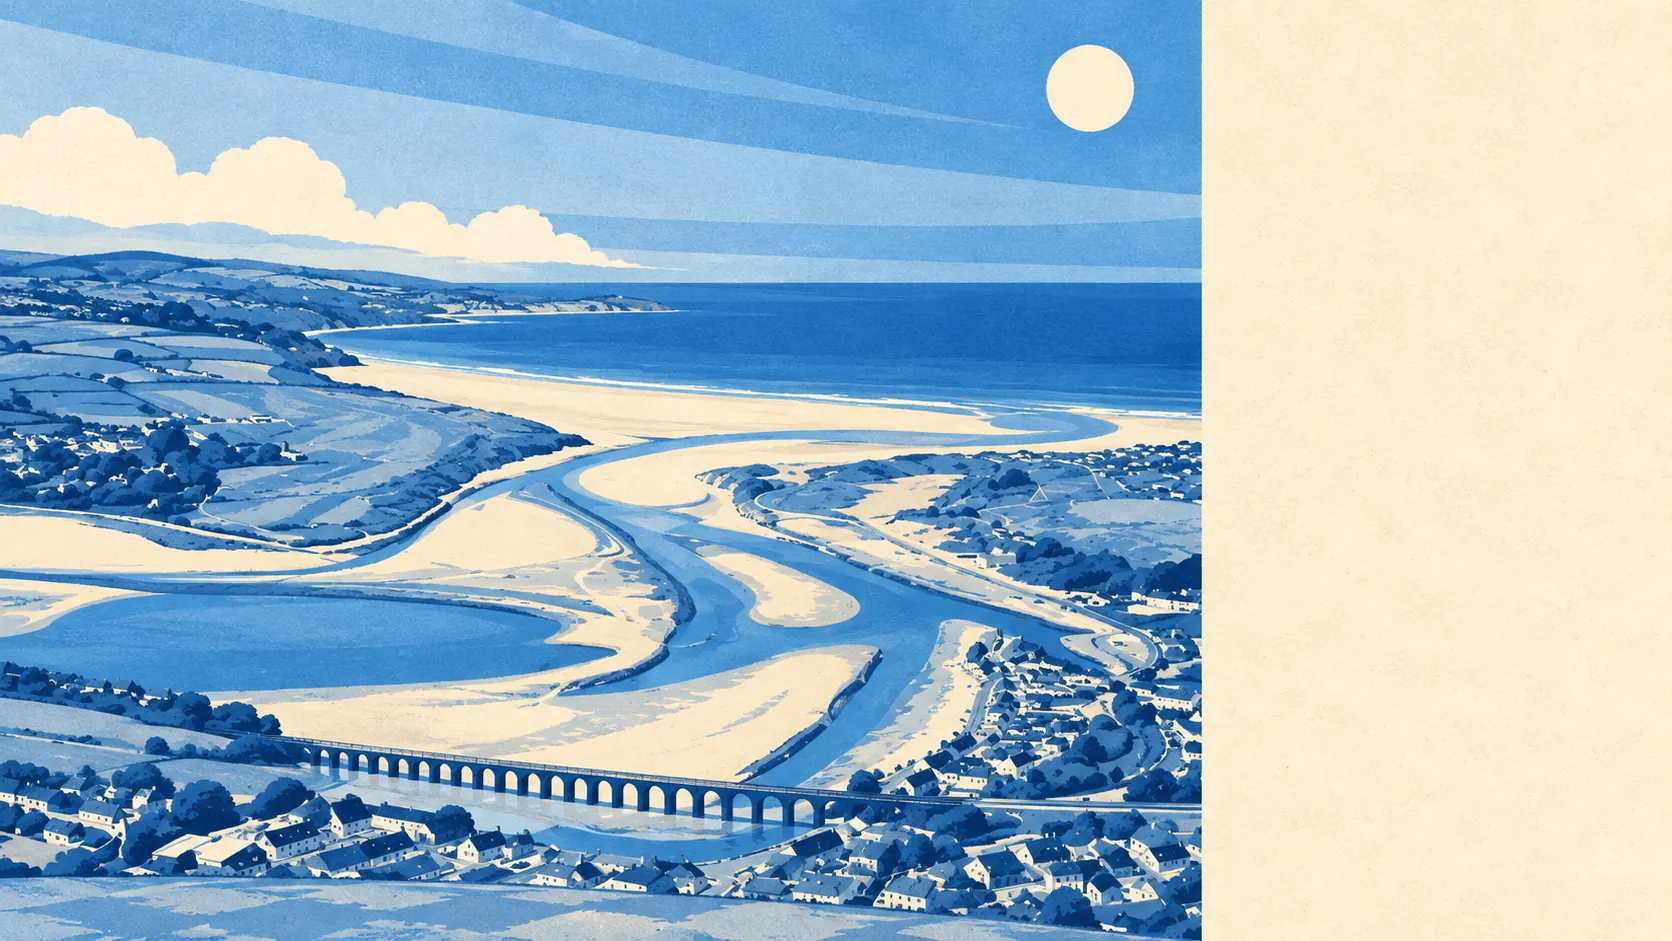
Yes, and anyone who builds a town in the mouth of an estuary knows why. Roughly one postcode in five rates high on at least one flood measure. Around one in ten sits in the highest river-and-sea flood zone. Seven in ten postcodes are within a short walk of the coast. This is not a scare story about a hillside town, it is the arithmetic of living where a river meets St Ives Bay, and it varies enormously street by street.
On the Environment Agency's river-and-sea mapping, about 9% of the area's postcodes fall in flood zone 3, the highest-probability band, and a further 4% sit in flood zone 2. Those two are exclusive bands rather than nested ones: zone 2 is the additional medium-probability fringe lying beyond zone 3, which is why it is the smaller of the two figures here. Together they describe the low ground around the estuary and the pools, and they say nothing at all about the properties on the slopes above.
Surface water is folded into the combined postcode indicators rather than published here as its own separate share, so the honest position is that the river-and-sea zones above are the cleanest measure of tidal and fluvial risk, and the combined figures further down are where drainage and run-off risk shows up alongside them.
Looking forward, the Environment Agency's climate-change allowance pushes the flood-zone share to about 24% of postcodes. That is not a prediction of what will flood, it is the modelled extent once higher sea levels and heavier rainfall are built into the maps, and it is the number that matters most to anyone planning to still own the property in thirty years.
For insurance, the practical consequence is that Hayle is a place where you get an indicative quote before you instruct a solicitor, not after. Cover is generally obtainable for homes in flood-risk areas, but the premium, the excess and the conditions depend on the individual address rather than the town, and a property in zone 3 with a flooding history is a materially different proposition from one two streets up the hill.
Across all measures combined, including surface water, about 19% of postcodes rate high on at least one indicator, roughly 21% rate medium and around 41% rate low. Those bands overlap with the flood-zone figures rather than adding to them, because a single postcode can appear in both. On the Environment Agency's rivers-and-sea property mapping, which lists only postcodes carrying some risk at all, 1,057 properties are mapped: 110 at high risk, 51 at medium, 138 at low and 202 at very low. Of the high-risk properties, 102 are residential.
On defences, about 9% of postcodes sit inside modelled high-risk flood extents with no defence present in the model, against roughly 6% where a defence is present. The second figure is not reassurance. A defence being in the model means something has been built and accounted for, not that the property behind it is safe, and defended areas can carry the deeper consequences when a defence is overtopped.
The coast is close by any measure. Around 71% of postcodes lie within 500 metres of the shoreline, a threshold the mapping defines rather than a claim about any particular house, and the median distance to the coast is roughly 367 metres. The closest postcode sits about 10 metres from it.
Every postcode in the area falls under a shoreline management plan, and the stated policy at all three horizons, twenty, fifty and a hundred years, is to hold the line. That is an intention to maintain defences over those periods rather than a guarantee, and it is not evidence that a defence already stands in front of any given property.
At the nearest tide gauge, at Devonport, the measured record between 1962 and 2015 shows sea level rising at about 2.35 millimetres a year. That is a historic rate from an instrument, not a forecast. Four flood events are on the recorded register for the area, the most recent in April 1985 and caused by the sea.
Flooding is the weakest part of Hayle's case, and the one thing on this page that genuinely warrants checking address by address rather than town by town. Put the exact postcode into the Environment Agency's long-term flood-risk service, get an indicative insurance quote, and ask the seller directly whether the property has flooded. The answers will differ sharply between two houses a few hundred metres apart.