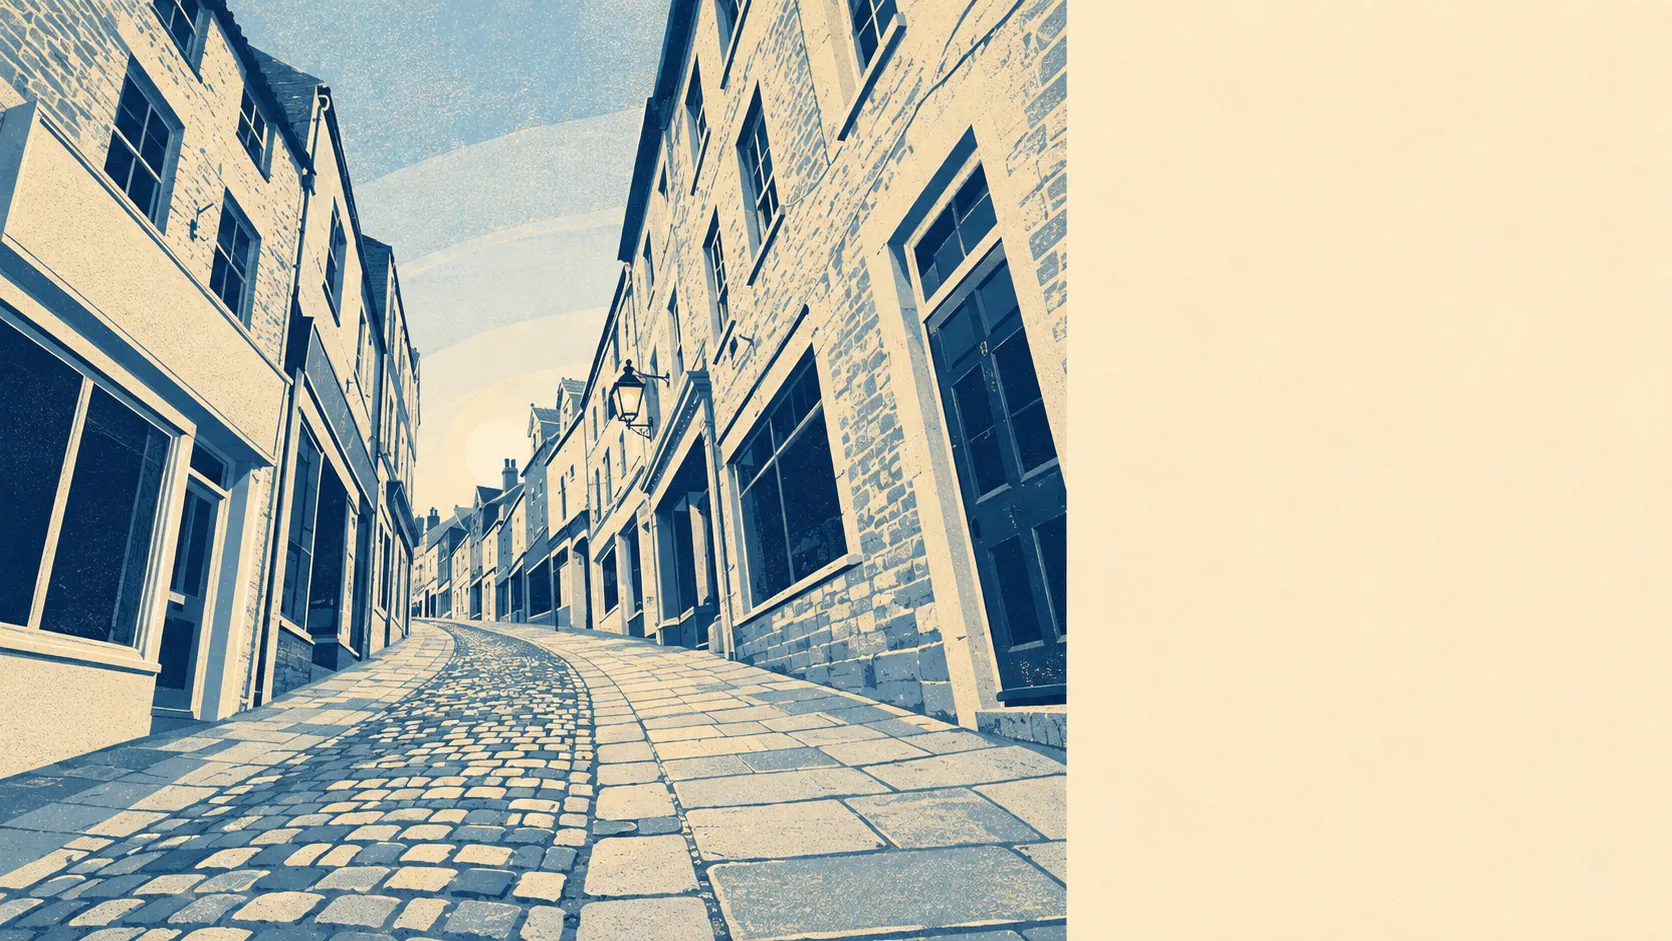
Mostly not, and where it is, the risk is a street-level question rather than a town-wide one. Frome is built on uneven high ground with its river cut down through the middle of it. Only a small share of the town sits in the river-and-sea flood zones. Rather more postcodes pick up some flag once surface water is counted. The flooding question here is not whether the town floods, it is which side of the hill your house is on.
Start with rivers and sea. The Environment Agency's mapping puts about 1% of the area's postcodes in flood zone 3, the higher-probability band, and about 2% in flood zone 2. Those two are separate bands rather than nested ones: zone 2 is the additional medium-probability fringe lying beyond zone 3, which is why it can be the larger figure without contradicting anything. Either way, this is a narrow ribbon following the water, not a general condition of the town.
Surface water is the risk the zone maps do not answer, and it is the one that matters more in a place where the streets run downhill into a valley floor. Around 2% of the area has a recorded historic flood on it. Forty-six flood events have been recorded here in total, the most recent in February 2009, logged against a main river and caused by overtopping of defences.
Looking forward, the climate-adjusted zone extends to about 4% of postcodes. That is the mapped allowance for a wetter future rather than a prediction of any particular year, and it roughly doubles the footprint the current zones cover.
For insurance, being inside a mapped zone or carrying a high indicator can mean higher premiums, a raised flood excess, or an insurer asking for a flood risk report before quoting. None of that is automatic and none of it is uniform across the town. The practical move is to run the exact address rather than the postcode through the Environment Agency's long-term flood risk service, then get an indicative quote before instructing a solicitor rather than after.
Across all measures combined, roughly 12% of the town's postcodes rate high on at least one flood indicator, about 17% medium and about 35% low. That folds surface water in alongside rivers and sea, so it overlaps with the zone figures rather than adding to them. It is a broader net catching anything with any flag, which is why the number looks so much larger than the zone share.
Counted as homes rather than postcodes, the Environment Agency's rivers-and-sea mapping lists 1,076 properties across the 50 postcodes here that carry any risk at all. Of those, 87 are at high risk, 94 at medium and 164 at low, with 45 of the high-risk properties residential. Postcodes with no risk do not appear in that list, so this is the affected slice of the town rather than the whole of it.
On whether anything stands between the water and the house: about 1% of postcodes fall inside the modelled high-probability extent with no defence present, and about 1% inside it with a defence present in the model. The word defended is doing less work than it sounds. It records that a structure exists in the modelling, not that the property behind it stays dry, and the town's most recent recorded flood was caused by defences being overtopped.
The nearest tide gauge is at Portsmouth, which tells you roughly how relevant the sea is to Frome. Over its record from 1962 to 2023 it has measured a rise of about 2mm a year. That is a measured historic rate at the coast, not a forecast for a Somerset valley.
Flood risk here sits in the middle: not a reason to walk away from the town, not something to skip on a specific address either. The height does most of the protecting, and the water goes where it has always gone.