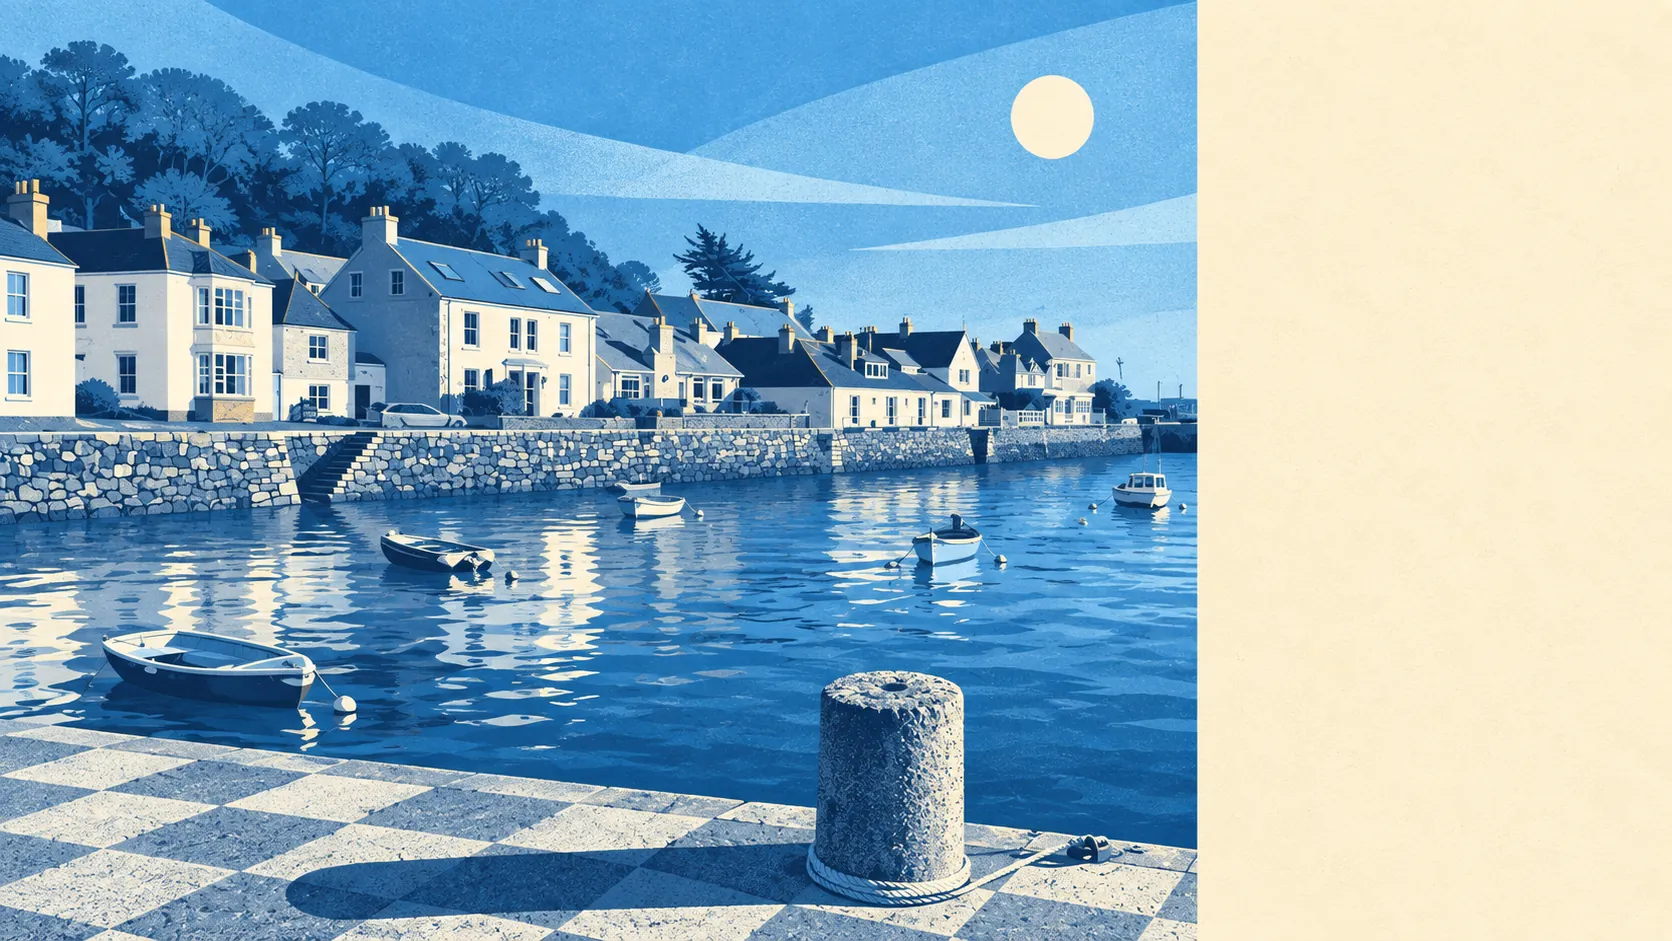
Yes, and more than most of Cornwall. Around a third of the village's postcodes carry a high flood flag on at least one measure. A chunk of it sits in the highest river-and-sea flood zone. Almost every postcode here is within a short walk of open water, and the nearest one is close enough to hear it from the kitchen. This is the single worst thing about living in Flushing, and it is not a detail anyone should discover during the survey.
On the Environment Agency's river-and-sea flood zones, about 13% of the village's postcodes fall inside flood zone 3, the highest-probability band. None fall in flood zone 2, which is the additional medium-probability fringe that sits beyond zone 3 rather than around it. That pattern is what you get on a steep-sided estuary: the ground either floods or climbs away from the water fast, with very little in between.
Surface water is harder to separate out here. The postcode-level indicators used below fold surface-water risk in with rivers and sea rather than publishing it as its own number, so the honest position is that the surface-water component cannot be isolated for this village. A property-level check is the only way to find out whether a particular address has a run-off problem as well as a tidal one.
Looking forward, the Environment Agency's climate-change allowance lifts the flood zone share to around 17% of postcodes. That is a modelled extension of the zone under higher sea levels, not a prediction that any specific house will flood.
For insurance, that combination matters more than the headline. Homes in the highest zone typically attract higher premiums, larger excesses on flood cover, or conditions attached to the policy, and lenders increasingly want to see cover in place before they commit. The Flood Re scheme exists to help with cover on higher-risk homes, but it does not cover homes built since 2009. Get an indicative quote on the specific address before instructing a solicitor.
Across all the postcode-level indicators combined, which take rivers, sea and surface water together, about 35% of the village's postcodes rate high on at least one measure, around 30% rate medium and roughly 44% rate low. Those bands overlap with the flood zone figures above rather than adding to them, and a single postcode can appear in more than one.
Counted as homes rather than postcodes, the Environment Agency's rivers-and-sea mapping lists 300 properties across the postcodes here that carry any risk at all, and only postcodes with some risk appear in that list. Of those, 40 are at high risk, 28 at medium and 23 at low, with 29 of the high-risk properties being residential. Two or three dozen homes is a small number in a city and a meaningful share of a village this size.
On defences, roughly 13% of postcodes sit inside a high-risk flood extent with no defence present in the model, against about 9% where a defence is present. A defence in the model means a structure exists, not that the house behind it is safe, and not that it will be maintained indefinitely.
The water is close. Around 91% of postcodes sit within 500 metres of the coast, that being the threshold the data uses rather than a claim about any one address, the median postcode is about 124 metres from it, and the closest is roughly 12 metres. Every postcode here is covered by a shoreline management plan, and the stated policy is to hold the line for the next 20 years, moving to managed realignment over the 50 and 100 year horizons. A policy is an intention to maintain defences over that period, not a promise, and not a defence that already stands.
At the nearest tide gauge, at Devonport, the measured rate of sea level rise across the 1962 to 2015 record was about 2.35 millimetres a year. That is a historic measurement of what happened, not a forecast of what comes next.
There is no recorded historic flooding in the area in the records held here. That is genuinely worth something, and it is not proof the village has never taken water, only that no event has been logged in the mapping.
Flood risk is where Flushing is at its weakest, by a distance. Everything else about the place, the safety, the walkability, the schools, can be weighed sensibly against price. This one has to be checked address by address, before an offer rather than after, because the village-level answer is unambiguous and unflattering.