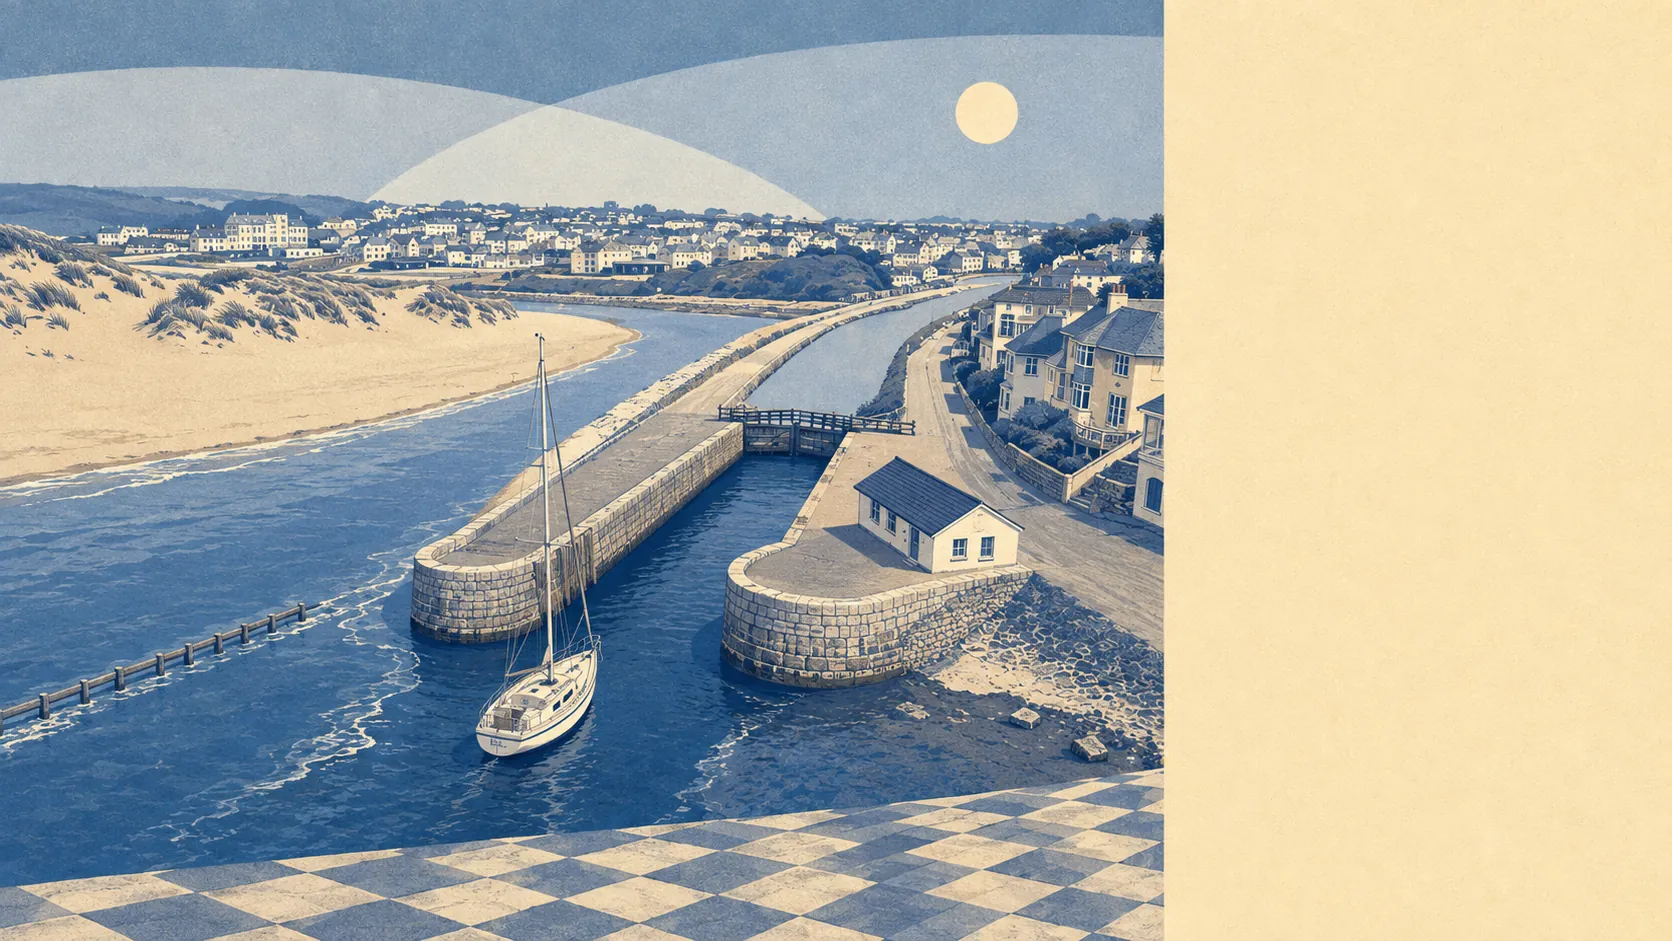
Yes, in the places you would expect, and hardly at all everywhere else. The town sits at a river mouth on an Atlantic coast, which is the geography that built it and the geography that soaks it. Roughly one postcode in six carries a high rating on at least one flood measure. Most of the town carries none. Flood risk in Bude is an address question rather than a town question, and treating it as the latter will either scare you off the wrong house or reassure you about the wrong one.
Start with rivers and the sea. The Environment Agency's flood zones cover about 4% of Bude's postcodes in zone 3, the higher-probability band, and about 6% in zone 2, which is the additional medium-probability fringe sitting outside zone 3 rather than wrapped around it. The two are separate bands, not a total and a subset. Roughly a tenth of the town is in one or the other, which for a settlement built where the River Neet meets the coast is a smaller footprint than most people assume.
Surface water is the awkward one, because Bude's postcode-level indicators bundle it in with rivers and sea rather than reporting it on its own. What the historic record does carry is nine recorded flood events, the most recent in June 1993, when channel capacity on a main river was exceeded with no raised defences in place. About 3% of the area has flooded historically. That is a short list for a coastal town, and it is also thirty years out of date, so it describes the past rather than the present standard of protection.
Add climate allowance and the exposed share grows to about 11% of postcodes falling within the flood zones. That is the forward-looking version of the same mapping, and it is the number a lender or an insurer will be looking at over the life of a mortgage rather than the life of a viewing.
For insurance, this matters in a specific way. A property inside a mapped flood zone can face higher premiums, a larger excess, or a policy routed through the Flood Re scheme, which does not cover homes built after 1 January 2009. None of that is visible from a listing photograph. Getting an indicative quote before instructing a solicitor is cheap. Discovering the answer after exchange is not.
Across all measures combined, about 17% of Bude's postcodes rate high on at least one flood indicator, roughly 14% medium, and around 37% low. Those bands fold surface water in alongside rivers and sea, so they overlap with the flood-zone figures rather than adding to them. The same postcode can appear in both counts.
Counted as homes rather than postcodes, the Environment Agency's rivers-and-sea mapping lists 1,190 properties across the 50 postcodes that carry any risk at all. Of those, 116 are at high risk, 79 medium, 283 low and 59 very low, with 62 of the high-risk properties residential. Postcodes with no risk do not appear in that list, so it is a picture of the exposed part of town, not the whole of it.
On whether anything stands in the way, about 4% of postcodes sit inside a high-probability flood extent with no defence present in the model, and about 5% inside one where a defence is. Being on the defended side of that split is not the same as being safe. It means a structure exists in the modelling, built to a design standard, which water can and occasionally does exceed.
The coast itself is close. About 37% of postcodes fall within 500 metres of it, a threshold the mapping defines rather than a judgement about any particular house. The nearest postcode sits around 23 metres from the coastline and the median across the town is roughly 680 metres.
Every postcode in Bude falls under a shoreline management plan. The most common policy over the next twenty and fifty years is managed realignment, and over a hundred years it becomes no active intervention. Read that carefully. A policy is a stated intention about how the coast will be managed, not a defence that already exists and not a promise that funding will follow. At the century horizon, the stated intention for most of this shoreline is to stop intervening.
At the nearest long-record tide gauge, at Devonport, sea level rose at a measured rate of about 2.35 millimetres a year across the 1962 to 2015 record. That is history rather than forecast, but it is the direction the shoreline planning is written against.
Of everything Bude has going for it, flooding is the part that drags. The risk is concentrated rather than general, which is genuinely good news, but the concentrated part is close to the water, close to the river, and covered by a long-term coastal policy that gets less protective the further out you look.