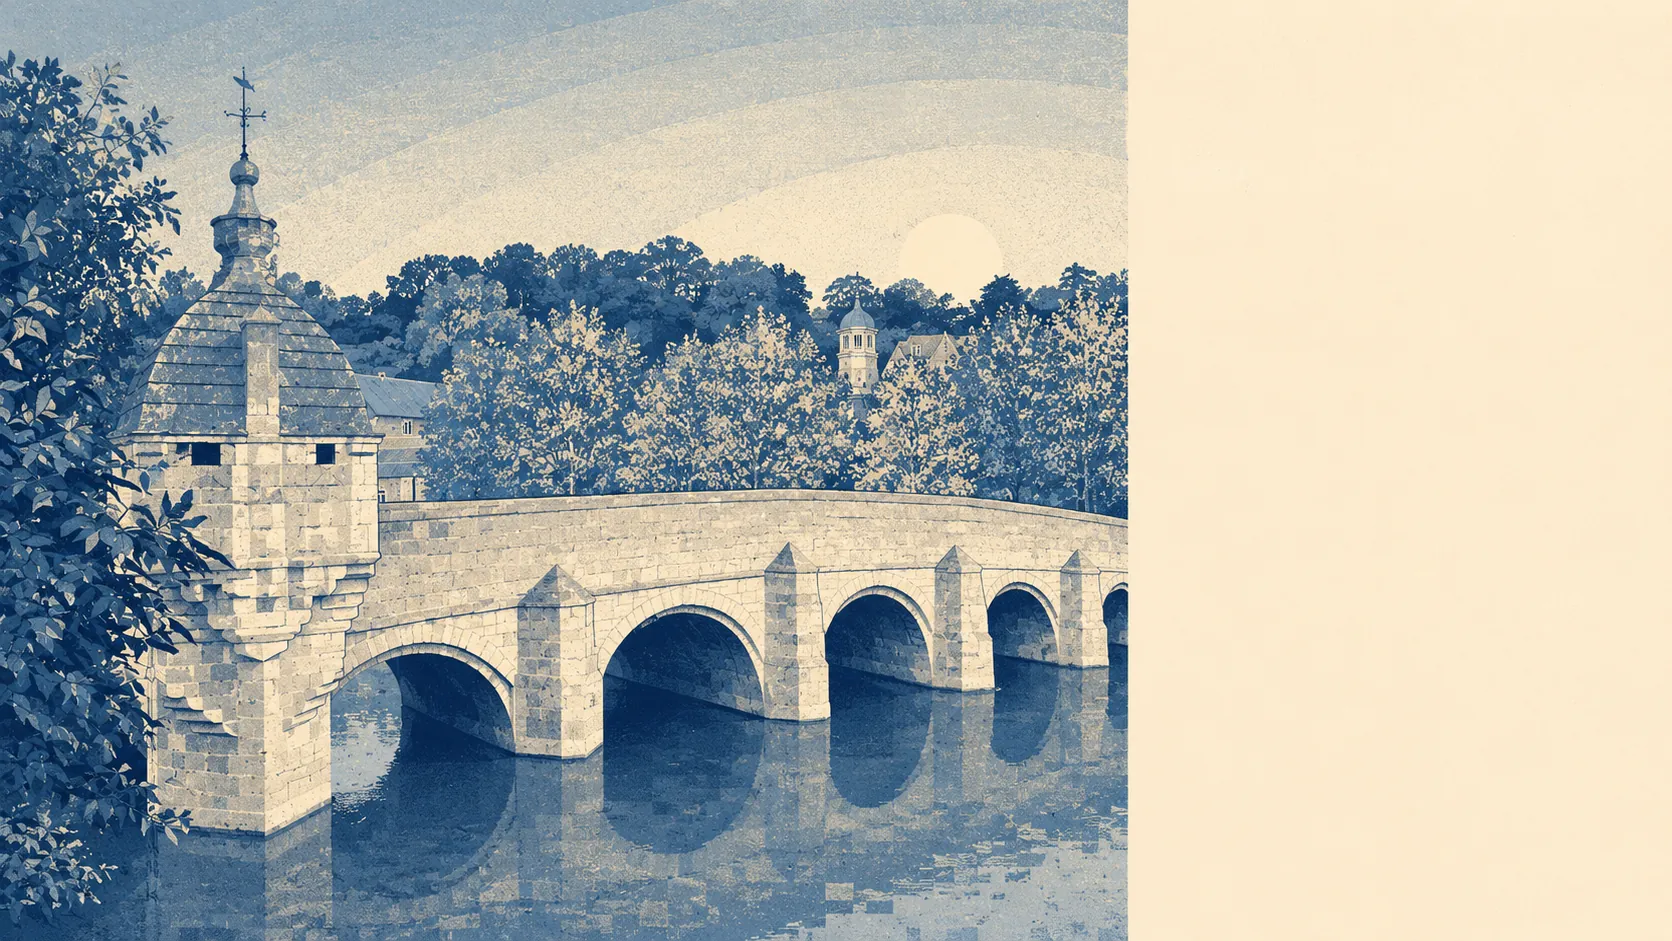
Partly, and the part matters. The town grew up around a ford across the Avon, which is not a neutral detail. A small slice of it sits inside the river flood zones. A much larger slice picks up a flag once surface water is counted. Most homes here are dry, and the ones that are not tend to be exactly where anyone looking at the valley would guess.
The Environment Agency's river-and-sea flood zones cover a narrow band of the town. Around 3% of postcodes fall in zone three, the highest-probability band, and around 2% in zone two, which is the additional medium-probability fringe lying beyond zone three rather than wrapped around it. They are exclusive bands, not one nested inside the other, so zone two being the smaller number is the mapping working correctly rather than a mistake.
Those zones describe rivers and the sea and nothing else. Surface water, the kind that comes off a hillside during a downpour and has no interest in what the Avon is doing that afternoon, sits in a separate set of indicators, and in a town built partly on a slope it is the risk people underestimate. The Environment Agency's recorded flood outlines touch about 7% of postcodes, with 36 flood events on record locally, the most recent in January 2014.
None of the town's postcodes fall inside the climate-adjusted zone extent, which models the river zones with a future climate allowance applied. That is a modelled projection rather than a guarantee, and the honest reading is that the current mapping does not push the zones wider here, not that nothing about the river will ever change.
For insurance, the thing that moves a premium is the address, not the town. A property inside a high-risk band changes what insurers quote and occasionally whether they quote at all, and it is the sort of discovery that is far cheaper before an offer than after one. Get an indicative buildings quote for the specific house before instructing a solicitor.
On the broader postcode indicators, which fold surface water in alongside rivers and sea, about 14% of the town's postcodes carry a high flag on at least one measure, about 18% a medium flag and about 39% a low one. Those bands overlap the zone shares rather than adding to them, and they cover more sources of water, which is why the number is so much larger than the 3% sitting in zone three.
Counted as homes rather than postcodes, which is the figure most buyers actually want, the Environment Agency's rivers-and-sea mapping puts 123 properties at high risk, 160 at medium and 153 at low, out of 674 properties across the 25 postcodes that carry any risk at all. Every postcode with no flagged risk is absent from that count entirely. Of the high-risk properties, 82 are residential.
Then there is the word nobody explains. Around 3% of postcodes sit inside the modelled high-risk extent with no defence counted, and around 3% sit inside it with a defence present in the model. The share does not move. Defended means a structure exists in the modelling, not that the water stops at it, and treating the label as reassurance is how people end up surprised by a river they could see from the kitchen window.
Sea level is context rather than a direct read here. The nearest tide gauge with a long record is at Portsmouth, where the measured rise across the record from 1962 to 2023 runs to about 2 millimetres a year. That is a historic rate at a coastal gauge, not a forecast, and not a number that governs what a Wiltshire river does in February.
Middling is the fair word. Bradford-on-Avon is not a floodplain town, but it is not a dry one either, and the mapping is precise enough that the individual address carries almost all the information. Two houses on the same street can sit on opposite sides of this answer.