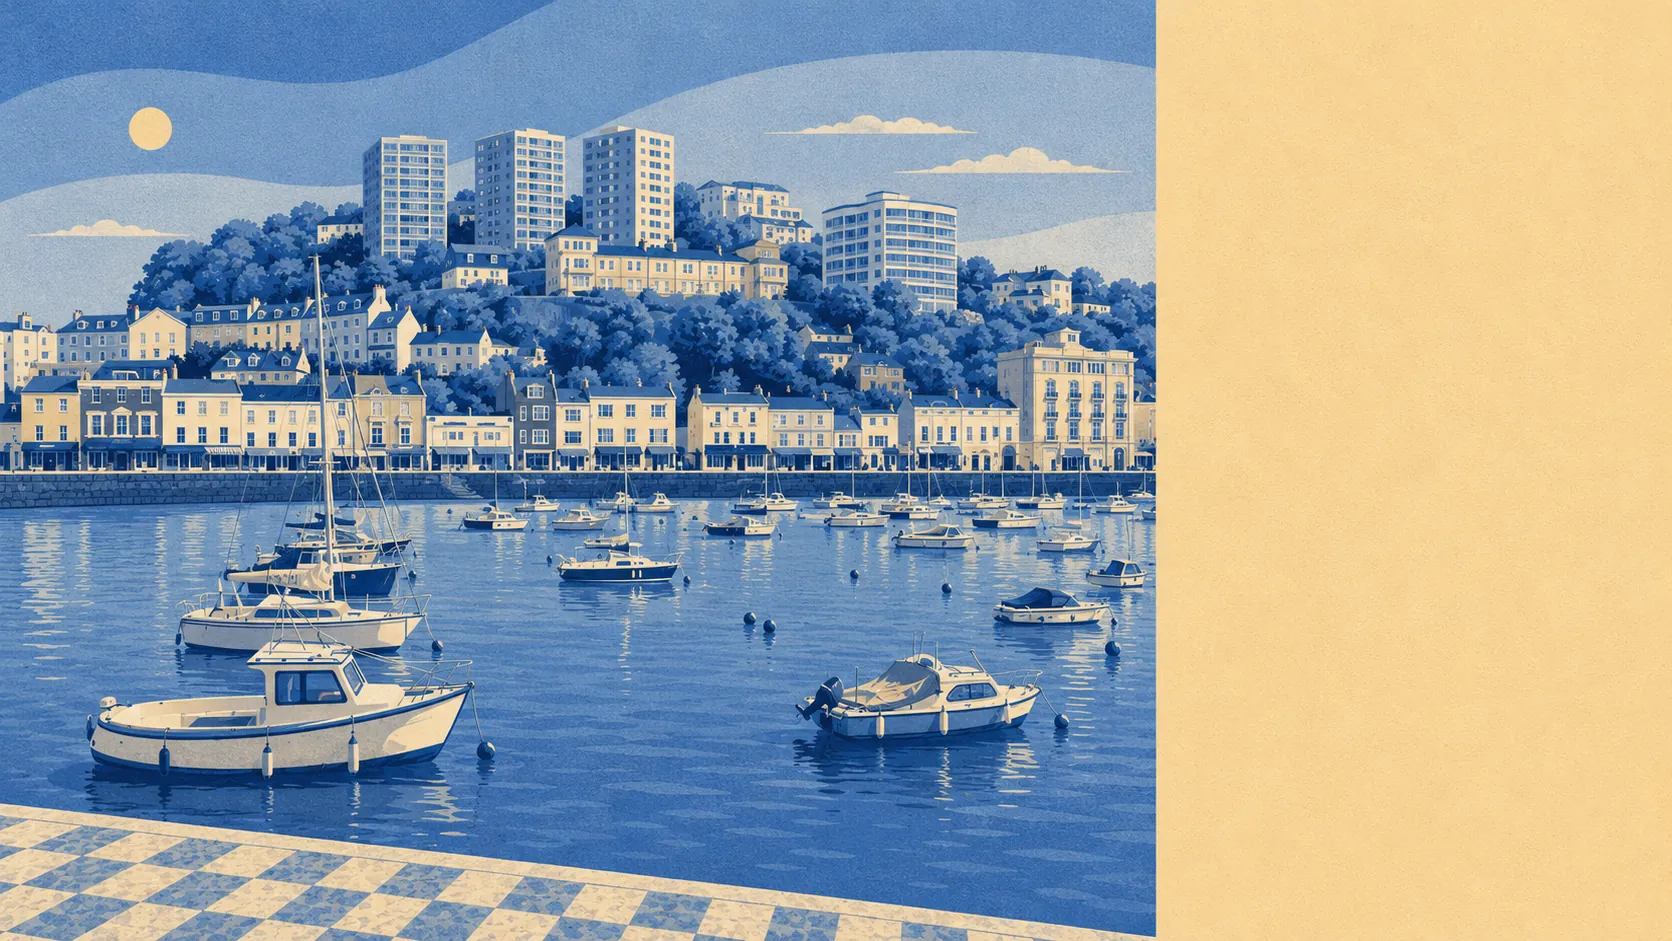
Mostly no, and the exceptions are the parts with the view. Only a thin slice of the town sits in the mapped river-and-sea flood zones. Around a quarter of postcodes are within a few minutes of the water. A few hundred homes carry a medium rating or worse. The risk here is concentrated rather than general, which is the worst possible shape for a buyer, because a town-level answer tells you almost nothing about the house you are standing in.
Take the river-and-sea mapping first. The Environment Agency's flood zones cover 4% of the area's postcodes in zone 3, the high-probability band, and half a percent in zone 2, the medium-probability fringe that sits beyond zone 3 rather than inside it. Zone 2 being the smaller number is not an error: it is the outer edge of a zone that barely reaches inland here. Torquay is built on hills running down to a bay, so the mapped river-and-sea risk hugs the low ground near the water and stops.
What those zones do not describe is rain landing on a slope with nowhere to go. Surface water is not mapped as its own flood zone, and it turns up instead inside the combined postcode indicators further down. In a town where the roads run downhill to a harbour, that is the flooding most residents actually encounter, and it is the one the zone map is silent about.
Adding the climate allowance, the share of postcodes inside the adjusted zone comes to half a percent. That is a forward look built into the Environment Agency's own modelling rather than a prediction anyone here has made.
For insurance, the practical consequence is that Torquay as a name does not raise premiums, but individual addresses absolutely can. Anyone buying near the harbour, the seafront or the bottom of a valley should get an indicative quote before instructing a solicitor rather than after exchange, because that is the point at which the loading, the excess, and the questions about previous claims all become someone else's problem to explain.
On the combined picture, 8% of the area's postcodes rate high on at least one flood measure, 10% rate medium and 20% rate low. Those bands fold surface water in alongside rivers and the sea, so they overlap with the zone figures rather than adding to them. The same postcode can appear in both counts, and a fifth of the town carrying some low-level indicator is a normal reading for a coastal settlement, not an alarm.
Homes are the more useful unit. Across the postcodes that carry any river-and-sea risk at all, and only those postcodes appear in the mapping, 2,870 properties are listed: 130 at high risk, 523 at medium and 226 at low. Ninety-three of the high-risk properties are residential. That is a specific, findable set of addresses rather than a vague coastal worry, and it is small enough that a surveyor can tell you in an afternoon whether yours is one of them.
Then the question the flood maps usually dodge. Roughly 1% of postcodes fall inside a modelled high-probability extent with no defence present in the model, against about half a percent where a defence is present. The word defended describes the model, not your kitchen. It means something has been drawn between the water and the buildings, not that the something will hold, and treating it as reassurance is how people end up surprised.
The coast is close by design. Around 24% of postcodes sit within 500 metres of the shoreline, the nearest comes within 9 metres of it, and the median distance across the town is 850 metres. Every postcode here falls under a shoreline management plan whose stated policy is to hold the line at twenty, fifty and hundred year horizons. A policy is an intention to maintain defences, not a defence, and not a promise.
For context on the water itself, the nearest tide gauge at Devonport recorded a rise averaging 2.35 millimetres a year across its 1962 to 2015 record. That is measured history rather than forecast.
Flood risk in Torquay lands in the middle: unremarkable for most of the town, genuinely serious for a small and identifiable number of homes near the water. Buy the address, not the reassurance.