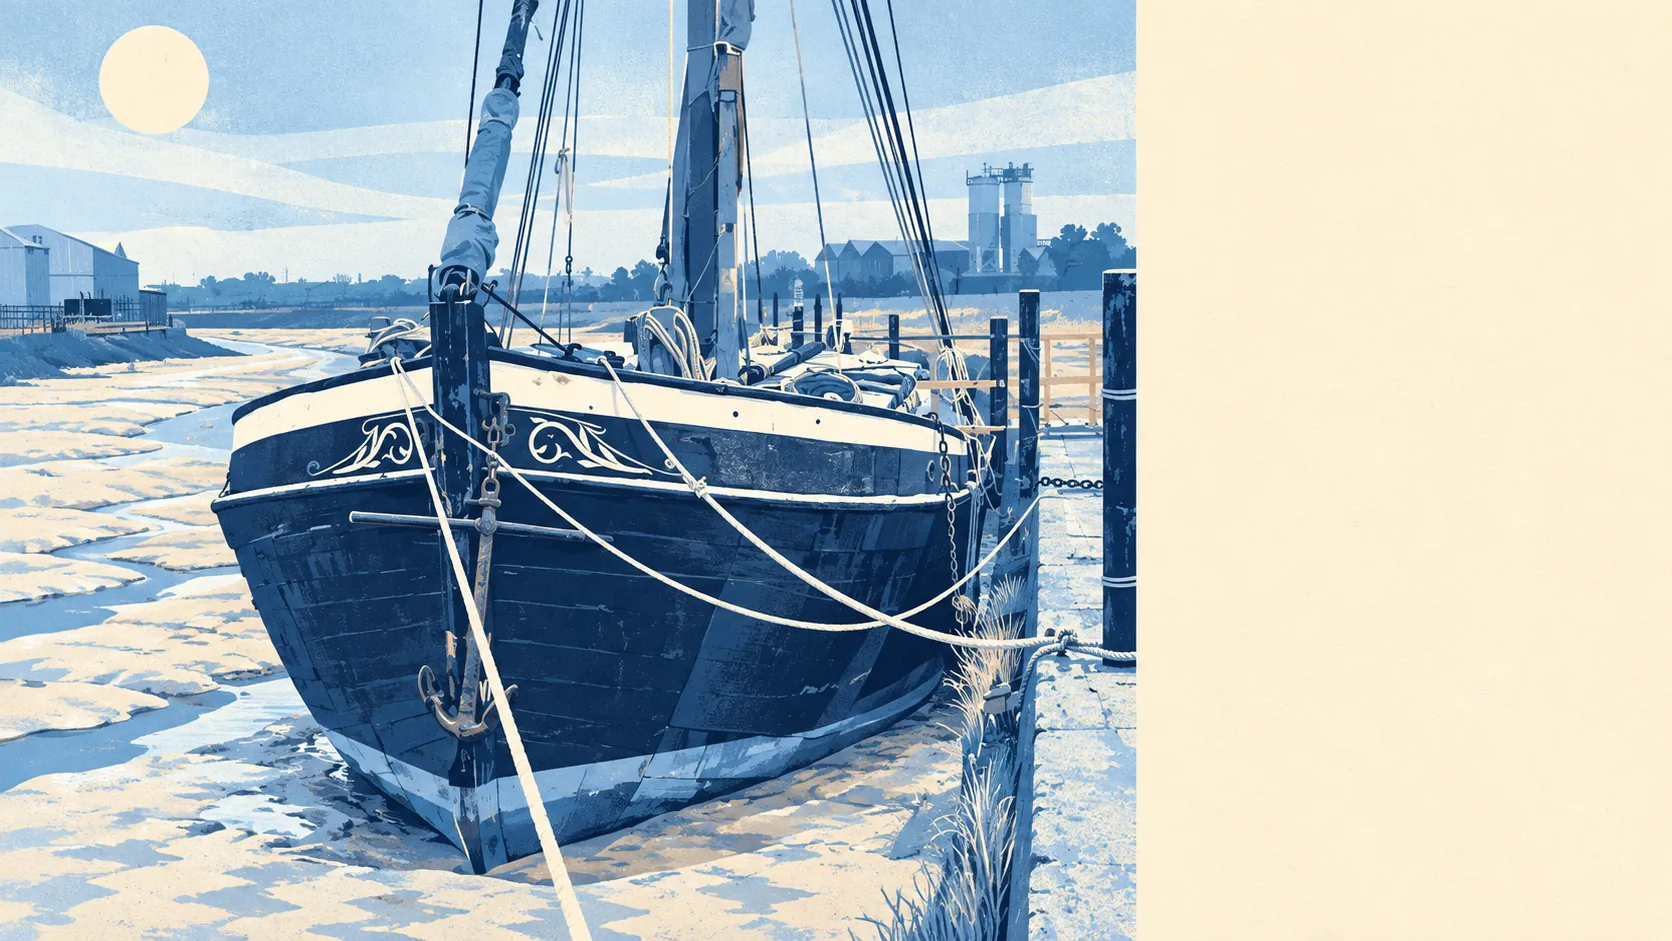
Mostly not, but the town grew up on a tidal creek, and the creek hasn't gone anywhere. About one postcode in seven is high risk on at least one flood measure. Only a small slice sits in the highest river-and-sea zone. The worst flood on record came in off the sea. The risk is real, it's narrow, and you can check it address by address before you buy.
On the Environment Agency's river-and-sea flood zones, about 6% of the area's postcodes fall in flood zone 3, the highest-probability band. Another 2% sit in flood zone 2, the medium-probability fringe beyond it. These are separate bands, so zone 2 is the extra ring outside zone 3, not a bigger area containing it. Most of the town is in neither.
Surface water, the rain that has nowhere to go, isn't broken out as its own share of postcodes here. It's folded into the combined postcode figures below. For history, about 4% of postcodes have a recorded flood on file. The Environment Agency's records hold 49 flood events, and the most recent major one was in 1953, when the sea overtopped the defences.
Allowing for climate change, the zone map widens: about 15% of postcodes fall inside the climate-adjusted flood zone. This is a planning allowance for the decades ahead, not a prediction about any particular winter, but it's worth knowing which side of that line a house sits before you commit to a long mortgage on it.
For insurance, a home in or close to the higher-risk zones can cost more to cover, carry a larger excess, or come with conditions attached. The only way to know is to get a quote on the actual address before you've spent money on a survey. A listing that says "moments from the creek" is describing the view. The insurer will describe the premium.
Counting every measure together, surface water included, about 15% of postcodes rate high on at least one of them, about 21% medium and about 45% low. Because a postcode only needs one measure to qualify, these bands overlap with the flood-zone shares above. They're a different way of counting, and they shouldn't be added to the zone figures.
Homes are a more useful count than postcodes. The Environment Agency's rivers-and-sea mapping lists 3,260 properties in 118 postcodes that carry some risk. Of those properties, 132 are at high risk, 116 medium, 538 low and 1,274 very low. Postcodes with no risk at all don't appear in the list, so that total isn't the whole town, just the part the water could plausibly reach.
On defences, about 6% of postcodes fall inside the high-risk flood extent when defences are left out of the model, against about 3% when they're included. The gap is the work the defences are expected to do. "Defended" means a defence exists in the model. It doesn't mean the house is safe, and 1953 is a reminder of what happens when a defence gets overtopped.
The coast is closer than the high street makes it feel. About 14% of postcodes sit within 500 metres of it, the nearest is just two metres away, and the median is about a kilometre. The 500-metre line is a threshold drawn for this measure, not a verdict on any one house.
The shoreline plan for this stretch is to hold the line over 20, 50 and 100 years, which means the stated intention is to keep maintaining the existing defences. That's a policy, not a promise, and it doesn't come with a budget attached.
At Dover, the nearest tide gauge, sea level rose at about 2.21 millimetres a year across its 1961 to 2010 record. That's a measured past rate, not a forecast.
- Put the exact address into the Environment Agency's long-term flood risk service.
- Get an indicative insurance quote before you instruct a solicitor.
- Ask the seller directly about past flooding and any insurance claims.
- For homes near Milton Creek or the Swale shore, ask your surveyor to look at drainage and the defences nearby.
Sittingbourne's flood risk sits in the middle: most homes are well clear of it, and the ones that aren't are close to the water. Check the address, not the town.