Silver End is a sound enough village with one figure a buyer has to deal with first: about 78 recorded crimes for every 1,000 residents, high enough to affect which street and which house make sense. Most of the rest holds up. Seven in ten own their home. Fields and water are a short walk from most doors. The man who planned the place built the biggest village hall in Britain, and nobody has needed a bigger one since.
Essex Police recorded crime at about 78 per 1,000 residents in the Silver End area, which takes in the surrounding villages, over the year to May 2026. That rate is roughly 23% above the average for Braintree district as a whole. Violence and sexual offences made up 43% of what was recorded, against 35% across England and Wales, and other theft took 12%, against 7% nationally. The violence heading is a broad statutory category that includes common assault where nobody was hurt, so the rate tells you how often the force opened a file and very little about what was in it.
Prices are easier to read. The Land Registry logged 107 sales in the year to May 2026 at a median of about £350,000. Detached houses went for about £467,000, semis for about £333,000 and terraces for about £290,000. Only four flats sold all year, at a median of about £187,500, a market small enough to know by name. Band C is the most common council-tax band, and 28% of homes are in bands A or B, so the bills land in the middle of the range.
Renting costs about £1,230 a month for a typical private let across the Braintree district as of April 2026, up about 5% on the year. That is a district-wide average from the Office for National Statistics, so a three-bed semi in the village and a one-bed in Braintree town centre are both in it.
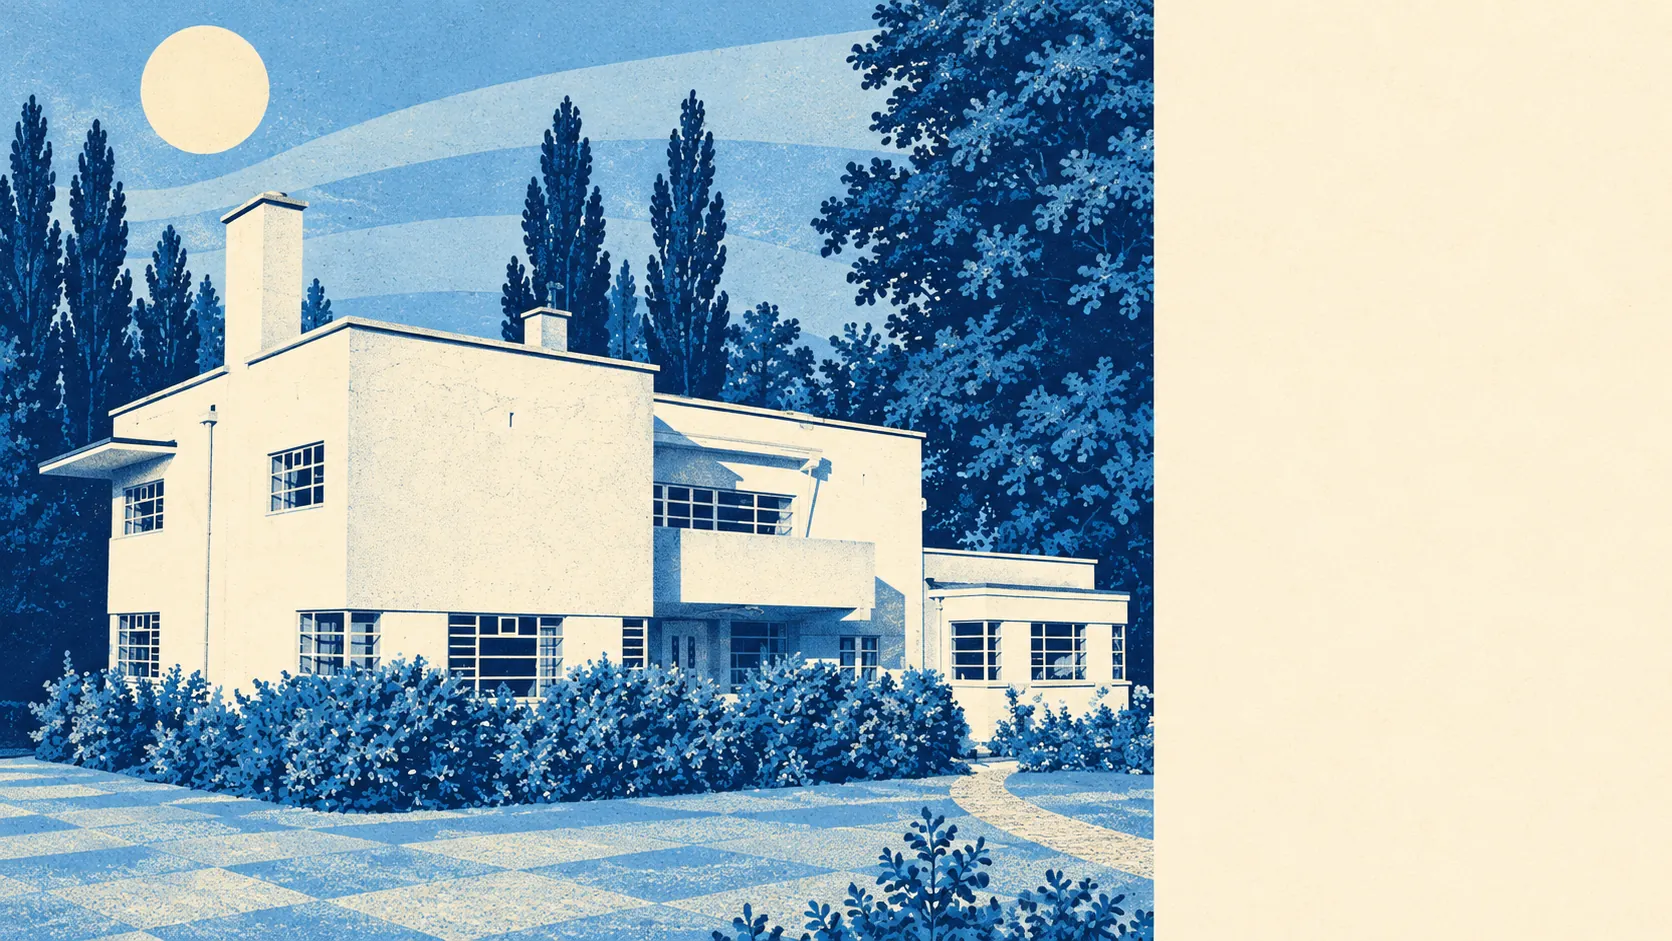
The council-tax valuation list sets out the stock. Semis make up 36% of homes, detached houses 25%, terraces 20%, bungalows 10% and flats 7%. Only 15% were built before 1930, and 69% of certificated homes are rated A to C for energy. Mains gas heats 73% of homes and 7% run on electricity alone. The white flat-roofed houses on Francis Way and Silver Street get photographed. The semi with a drive gets bought.
That modernist core is protected. Silver End has its own conservation area, Cressing and White Notley have one each nearby, and the wider area holds 221 listed buildings, ten of them Grade I. In a conservation area the council takes an interest in changes to the outside of a house. In a village built by a window maker, it is easy to guess which change they ask about first.
Getting around mostly means the car. In the 2021 census, 61% of working residents drove to work, 27% worked from home and 2% took the train. White Notley is the nearest station, on the branch line, and most commuters drive to Witham instead. The area has 121 bus stops, averaging about 41 weekday departures each, or around two an hour at peak, and 88% have a weekend service. The Department for Transport's 2019 model puts the nearest town centre 14 minutes away by car and about 31 by public transport. Bus services have been cut in plenty of places since 2019, so the public transport figure is the less reliable of the two. Gigabit broadband reaches 84% of premises and superfast 94%, which is why working from home is a lot more common here than the train.
Flood risk depends on which measure you use. On the site's own indicators, which include surface water, 17% of postcodes in the Silver End area carry a high rating on at least one. In the Environment Agency's river-and-sea flood zones the picture is far smaller, with about 1% of postcodes in Zone 3 and none in Zone 2. The agency has two recorded floods here, the latest in 1947, when a main river overtopped its channel. A clean river history says nothing about where rain collects on a road.
The countryside is where Silver End does well. The nearest green space is about 250 metres from the average home, with around ten within a kilometre, and water is roughly 200 metres away. The dog walk starts at the front gate, and the footpaths and field edges go on far longer than the dog does.
Most people here own their home. In the 2021 census, 69% of households owned outright or with a mortgage, and the median age was 40. The Office for National Statistics models gross household income at about £59,600 for the financial year to March 2023, averaged across the wider area. Tye Green comes under this page as well. Francis Crittall opened a department store for his workforce in 1928, it burnt down in 1951, and it was rebuilt to become the Co-op, an ending about as English as a model village could have.
Silver End Academy covers primary age, about an 11-minute walk for a typical household. Across the nine primary schools in the area's postcode districts, the average Key Stage 2 maths score is 103. Secondary pupils mostly go towards Witham and the Lift schools, Lift Maltings and Lift New Rickstones among them. The two secondary schools in the districts average an Attainment 8 score of 40. Secondary school is a 12-minute drive or a bus, and the walk works out at nearly an hour, a figure any teenager will remember.
Silver End is right for families after a semi with a drive and fields nearby, and for people who work from home on a good connection and only need Witham now and then. It is wrong for anyone who wants to walk to a fast train, and for a buyer who wants a crime rate they never have to think about. That rate is the real cost here. It runs well above the rest of the district, and Essex Police's broad categories don't show whether it comes from the street you are looking at, so it has to be weighed against the house. Set against it are open country, solid family housing and prices that make sense, which leaves Silver End a middling choice that does the basics well and comes with one clear warning.