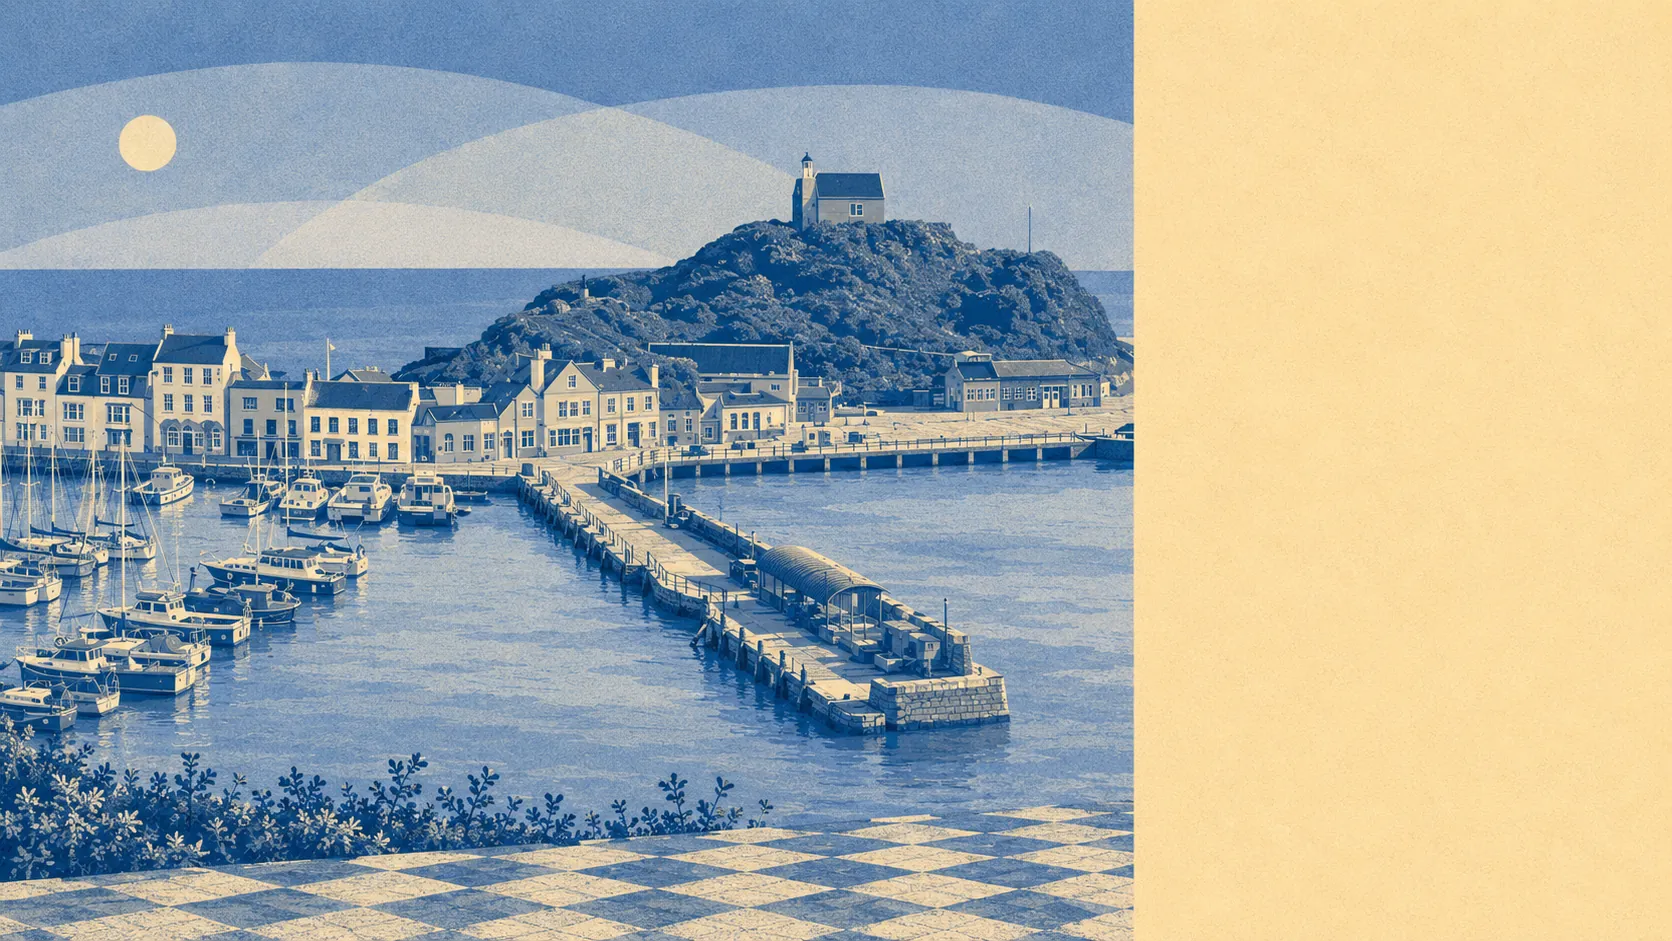
Parts of it, yes, and the parts are predictable. Ilfracombe is a town folded into a valley that empties into a harbour, so water has one obvious route through it and that route is also the road. About one in ten postcodes sit in the highest river and sea flood zone. Around two-thirds sit within a short walk of the water. The risk here is concentrated rather than general, which is reassuring for most of the town and no comfort whatsoever at the bottom of the hill.
In the Environment Agency's river and sea flood zones, about 10% of the area's postcodes fall in zone 3, the highest-probability band, and about 1% in zone 2. Zone 2 is the medium-probability fringe lying beyond zone 3 rather than a larger band containing it, so the smaller figure is doing exactly what it should. Anyone reading those two numbers as a contradiction has been misled by a dashboard, not by the mapping.
Surface water is not published here as a share of its own. It is folded into the postcode-level indicators further down, which is a pity, because the topography is the whole story in a town like this. One reading of the name recorded in the medieval sources translates as the valley with the bad ford, and the ground has not changed its mind since. Steep sides, a single valley floor, a harbour at the bottom. Rain arrives somewhere and leaves through town.
Looking forward, about 3% of postcodes fall inside the flood zone once the Environment Agency's climate change allowance is applied.
For insurance, this matters in a specific and unglamorous way. Cover is normally available, but a property inside a high-risk zone can attract a higher premium, a higher excess, or questions about previous claims, and none of that is discoverable from the listing. Get an indicative quote against the exact address before instructing a solicitor rather than after the survey, when the price of finding out goes up.
Taking all the indicators together, about 22% of postcodes rate high on at least one flood measure, about 9% medium and about 21% low. That measure folds surface water in alongside rivers and the sea, so it overlaps with the zone figures above rather than adding to them. It is a wider net, deliberately.
Counted as homes rather than postcodes, the Environment Agency's rivers and sea mapping lists 1,741 properties across the 65 postcodes that carry any risk at all, with 665 of them at high risk, 66 at medium, 32 at low and 9 at very low. Of the high-risk properties, 504 are residential. Postcodes with no risk do not appear in that list at all, so this is the exposed slice of the town rather than the town.
Whether anything stands between the water and the building is the question buyers rarely think to ask. About 9% of postcodes sit inside a high-risk flood extent with no defence present in the model, and about 6% inside one where a defence is present. Present in the model means recorded as existing, not tested and not guaranteed. The single flood event on the recorded register here, in January 2014, came from the sea overtopping defences, which is precisely what a defence being present looks like on a bad night.
The water is close. About 65% of postcodes sit within 500 metres of the coast, that being a threshold the data draws rather than a claim about any one address, with the closest postcode 23 metres from the shore and the median around 360 metres.
Every postcode here falls under a shoreline management policy of hold the line across the 20, 50 and 100-year horizons. That is a stated intention to maintain defences over those periods. It is not a defence, not a budget line, and not a promise.
At the nearest tide gauge with a long record, at Devonport, sea level rose by about 2.35 millimetres a year across the 1962 to 2015 record. Measured history rather than a projection.
Flooding is one of the weaker parts of the case for Ilfracombe, and it is address-specific in a way that no page can settle for you. Put the exact property into the Environment Agency's long-term flood risk tool before you fall in love with the harbour view.