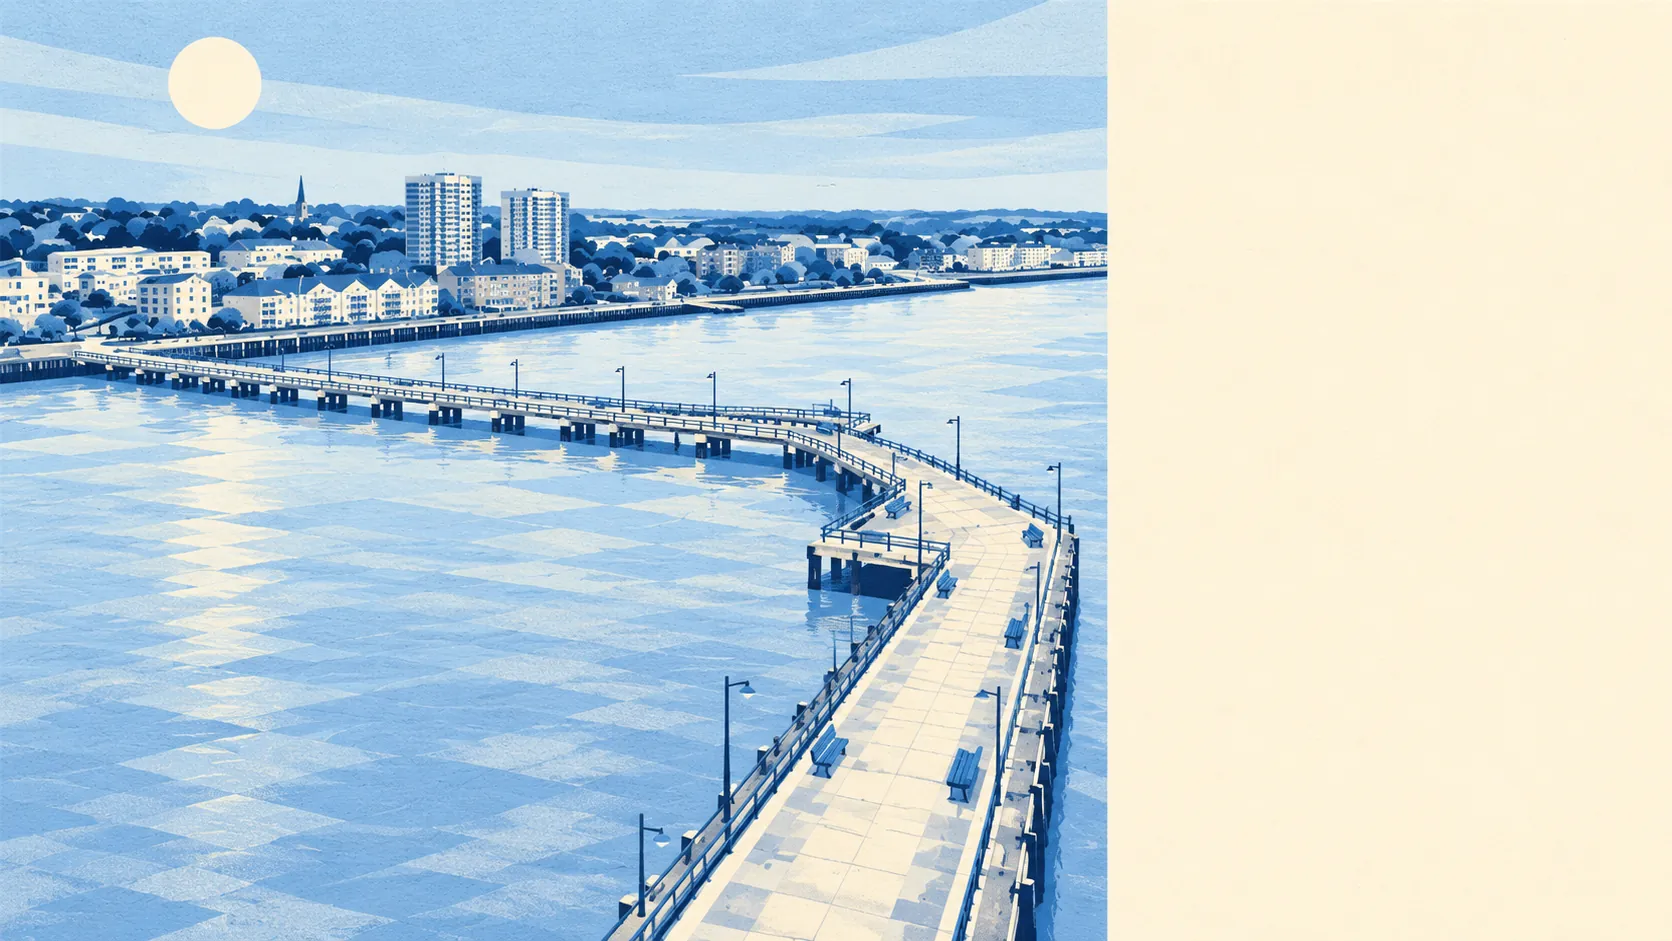
Yes. Erith carries a real flood risk, and nearly all of it comes from the Thames that put the town there. About a sixth of the area's postcodes are in the highest river-and-sea flood zone. A similar share rate high on at least one flood measure. With climate change factored in, that rises to over a quarter. Erith owes its existence to the river, and the river still holds a claim on some of it.
The Environment Agency's river-and-sea mapping puts about 16% of Erith's postcodes in Flood Zone 3, the highest-probability band. Another 4% are in Flood Zone 2, the medium-probability fringe outside it. The two bands don't overlap, so the smaller zone 2 figure is extra ground beyond zone 3.
Surface water has no figure of its own for Erith on this page. It is counted in the postcode measure further down. The Environment Agency's historic flood outlines cover about 12% of the area's postcodes, and its records hold 77 flood events. The most recent came in February 1953, when the sea broke through a defence that failed.
With the Environment Agency's climate change allowance applied, about 27% of postcodes fall in the flood zones. That is the agency's planning picture for a wetter future, and it describes a scenario. Nobody has yet measured it as something that has happened.
For insurance, the postcode matters as much as the house. A home in zone 3 can be harder to cover, can come with a larger excess and can cost more to insure than a similar house up the hill towards Northumberland Heath. Ask for a buildings insurance quote on the exact address while the mortgage valuation is being booked. A quote is the one figure in this process that comes from the people who would pay out.
Taking every flood measure together, rivers, sea and surface water, about 16% of Erith's postcodes rate high on at least one, 21% medium and 43% low. A postcode only needs one measure to make the list, so these shares count something different from the zone figures above.
Counted by property, the Environment Agency's rivers-and-sea mapping covers 3,678 properties in the postcodes that carry any risk at all. Postcodes with no risk are left out. Of those properties, 43 are at high risk, 33 of them homes, 9 at medium, 92 at low and 2,215 at very low. Most of the water in the zone maps meets very few front doors.
The modelled flood extents place about 8% of postcodes in the high-risk area with no defence in the model, and less than 1% in the high-risk area where a defence is present. "Defended" means only that a wall or barrier appears in the model. It says nothing about how well that wall would hold. The last flood on the Environment Agency's record was the 1953 breach of a defence, and that is the context for reading the word here.
The nearest tide gauge, at Dover, recorded sea level rising by about 2 millimetres a year between 1961 and 2010. That figure is a measured history from one gauge, some way down the coast.
Flood risk is one of Erith's weaker points. The number of homes at high risk is small, but parts of the town depend on the river wall holding.