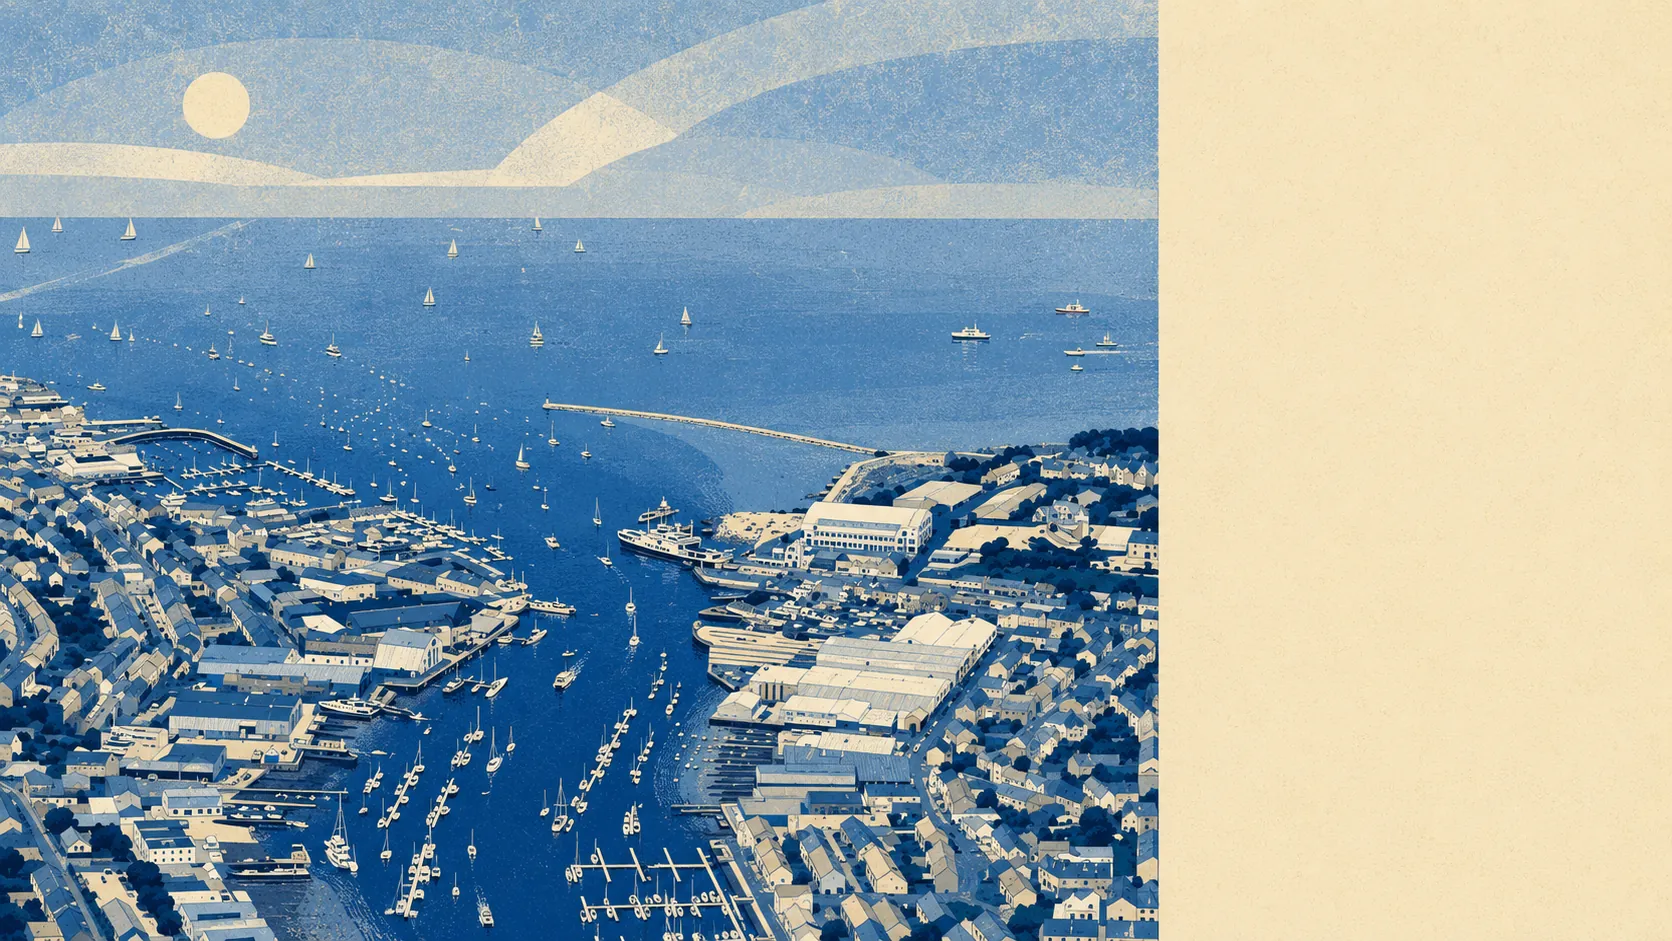
Parts of it, and predictably the parts with the view. Most of the town sits outside the river-and-sea flood zones entirely. About one in six postcodes carries a high flag on at least one flood measure. Six in ten sit within a few hundred metres of the coast. Cowes grew up around an estuary mouth, and an estuary mouth has never once agreed to stay dry.
Taking the river and sea risk first, the Environment Agency's mapping puts about 6% of Cowes postcodes in Flood Zone 3, the highest-probability band, and about 1% in Flood Zone 2. Zone 2 being the smaller number is not an error. It is the additional medium-probability fringe sitting outside zone 3, not a wider band containing it, so the two add up rather than nesting.
Surface water is the risk that never appears on its own in the published town-level figures. What exists at postcode level bundles rainfall runoff in with rivers and tide rather than separating them out, so there is no standalone surface-water share to quote for Cowes. The tell is that the combined postcode indicator runs considerably higher than the zone shares, which means the extra exposure is not all coming from the Medina and the Solent.
Looking forward, the share of the area inside the flood zones rises to about 12% once the Environment Agency applies its climate change allowance. That is the same map with the sea and the rainfall turned up, and it roughly doubles the footprint.
For insurance, the practical effect is that a Cowes address is worth checking before an offer rather than after. Cover is generally obtainable, but a high-risk address changes the questions the insurer asks, the excess it sets, and how quickly a quote comes back. An indicative quote costs nothing and takes an afternoon.
At postcode level, folding every measure together including surface water, roughly 17% of Cowes postcodes rate high on at least one, about 11% rate medium, and about 28% rate low. Those bands overlap the flood zone figures rather than sitting alongside them, so they cannot be stacked on top. They are the same town measured a different way, and the wider net catches more.
Counted as homes rather than postcodes, the Environment Agency's rivers-and-sea mapping lists 53 Cowes postcodes carrying some level of risk, covering 1,185 properties in total. Of those, 403 are rated high risk, 46 medium, 71 low and 3 very low. 143 of the high-risk properties are residential. Only postcodes that carry some risk appear in that listing at all, so the count describes the exposed edge of the town rather than the whole of it.
On whether anything stands in the way, about 6% of postcodes fall inside the modelled high-risk extent with no defence in the model, and the same 6% fall inside the defended extent. Defended means a defence exists in the modelling, not that the property behind it stays dry. When the defended and undefended shares match, the defence is not shrinking the high-risk footprint.
The water is close. Around 60% of postcodes sit within 500 metres of the coast, which is a threshold the mapping sets rather than a statement about any one house. The closest postcode sits about 5 metres from the coastline, and the median across the town is about 350 metres.
Every Cowes postcode falls under a shoreline management plan, and the stated policy across the 20, 50 and 100 year horizons is hold the line. That is an intention to maintain coastal defences over those periods. It is not a guarantee, it is not funded in advance, and it is not the same thing as a defence already standing.
At the nearest tide gauge, at Portsmouth, sea level has risen at about 2mm a year across a record running from 1962 to 2023. That is a measured historic rate over six decades, not a projection.
Flooding is the one genuine black mark on an otherwise likeable town. The risk is concentrated rather than general, which is good news for most of Cowes and no comfort whatsoever to the addresses nearest the water.