Charlton is a place where the people buying homes are outnumbered on their own street, and that shapes how living here feels. About four in ten households own. Nearly as many rent from a social landlord. A buyer here is the minority with a mortgage, and it takes the parks and the trains to pull Charlton onto the right side of average.
Census 2021 puts home ownership in Charlton at about 40%, with about 21% renting privately and about 38% in social housing. The typical resident is 35. The Office for National Statistics models gross household income at about £72,000 a year for the financial year to March 2023, averaged across the area before tax, and that average covers a wide split: about 47% of residents hold a degree and 17% have no qualifications. Charlton climbed between the 2019 and 2025 editions of the English Indices of Deprivation, though it still ranks below the middle of the table. Two quite different Charltons wait on the same platform every morning, and only one of them is reading the conveyancing paperwork.
Crime runs at the borough's pace. The published police figures for the twelve months to May 2026 give Charlton about 119 crimes per 1,000 people, against about 118 for Greenwich as a whole, so the two are level. Shoplifting makes up about 12% of recorded crime here, against about 8% across England and Wales. That is what putting the Greenwich Shopping Park, the Peninsula Retail Park and Stone Lake Retail Park in one neighbourhood does to a crime mix. The Metropolitan Police, as a force, charged about 10% of crimes over the same year against about 12% nationally, ranking 33rd of 42 forces, and that is a London-wide figure.
Getting out is easy. Charlton Rail Station is at the bottom of Charlton Church Lane, with Westcombe Park and Woolwich Dockyard on the same line either side. There are 86 bus stops, and the stops with timetable data average about 500 weekday departures and about 27 buses in the peak hour, with every one of them running at weekends. At the 2021 Census about 40% of workers were working from home, 8% took the train, 11% the bus and 18% drove. About 43% of households have no car at all, which looks a lot like good judgement to anyone who has sat on the southern approach to the Blackwall Tunnel. Gigabit broadband reaches about 80% of premises and superfast about 98%, and every postcode gets 4G or 5G from at least one network.
The flood picture is mixed. On the Environment Agency's river-and-sea flood zones, about 15% of Charlton falls in zone 3 and about 4% in zone 2. On the wider postcode indicators, which include surface water, about 23% of postcodes carry a high rating on at least one measure. The last flood in the agency's records was in January 1928, when the main river overtopped its defences. The southern end of the Thames Barrier is in New Charlton, and the Environment Agency still draws the zones around its own front door.
Schools are steady at primary level. The seven primary schools in the district, among them Charlton Manor, Fossdene and Sherington, average about 106 in Key Stage 2 maths. Royal Greenwich Trust School, the one secondary in the district, averages about 37 on the Attainment 8 measure of results at sixteen. Across Greenwich, 37 of the 40 settings counted with a published inspection grade are rated good or outstanding, 11 of them outstanding.
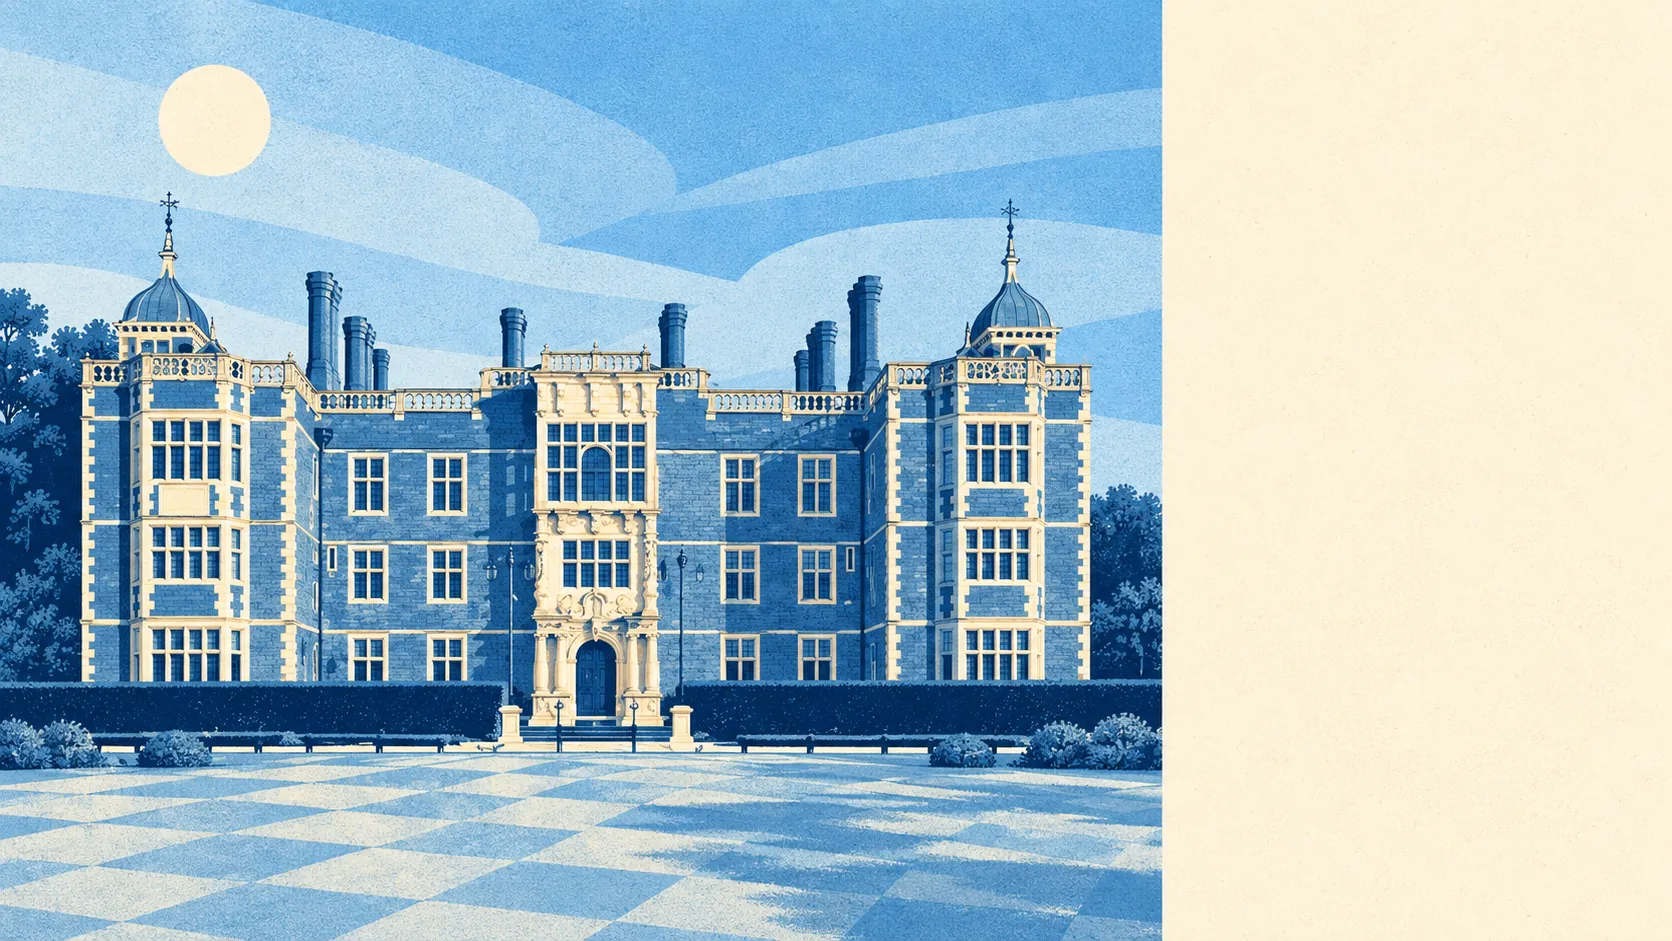
Heritage rules touch fewer homes than the history suggests. There are 47 listed buildings, four of them grade I, three grade II* and 40 grade II, plus one conservation area and five entries on Historic England's Heritage at Risk register. Charlton House is the obvious one. The garden house north-west of it is also listed, and it is now a public lavatory, so even the toilets here have consent to worry about.
The Land Registry recorded 109 sales in the year to May 2026, at a median of about £485,000. Flats went for about £375,000 across 48 sales, terraced houses for about £700,000 across 46, and semi-detached houses for about £503,000 across just 14. The terrace beating the semi by that margin tells you what Charlton buyers are paying for, and it isn't a side passage. Band C is the most common council-tax band, with about 34% of homes in bands A or B.
Renters should budget for Greenwich as a borough, where the Office for National Statistics puts typical private rent at about £1,950 a month as of April 2026, up about 4% on the year.
The council-tax list says flats make up about 55% of homes, terraced houses about 34%, semis about 9% and detached houses under 1%, with about 33% built before 1930. About 57% of homes with an energy certificate rate C or better and about 8% rate E or worse. About 74% heat with mains gas, so the Edwardian terraces mostly come with ordinary boilers.
Green space is where Charlton is strongest. The nearest park is about 170 metres from the typical front door, with around 37 green spaces within a kilometre, and the Thames is under a kilometre away. Maryon Park, Maryon Wilson Park, Hornfair Park and Charlton Park are all close by, and so is Gilbert's Pit, a Site of Special Scientific Interest that once supplied central London with most of its household sand. It is the only piece of that industry that nobody built over.
Charlton works for buyers who want parkland, a station and a bus every couple of minutes, and who are happy to own in a street where most neighbours rent. Anyone who wants a neighbourhood of fellow owners with matching kitchen extensions should look further up the hill towards Blackheath and pay for the privilege.
The community figures are the weak spot. A buyer here is putting money into a place that is still climbing the deprivation tables, where the average income hides a wide split and owners are outnumbered by renters. The parks are a short walk from almost everyone, and that, along with the trains, is what puts Charlton above average. Buy here for the green space, and accept that the neighbourhood is still catching up.