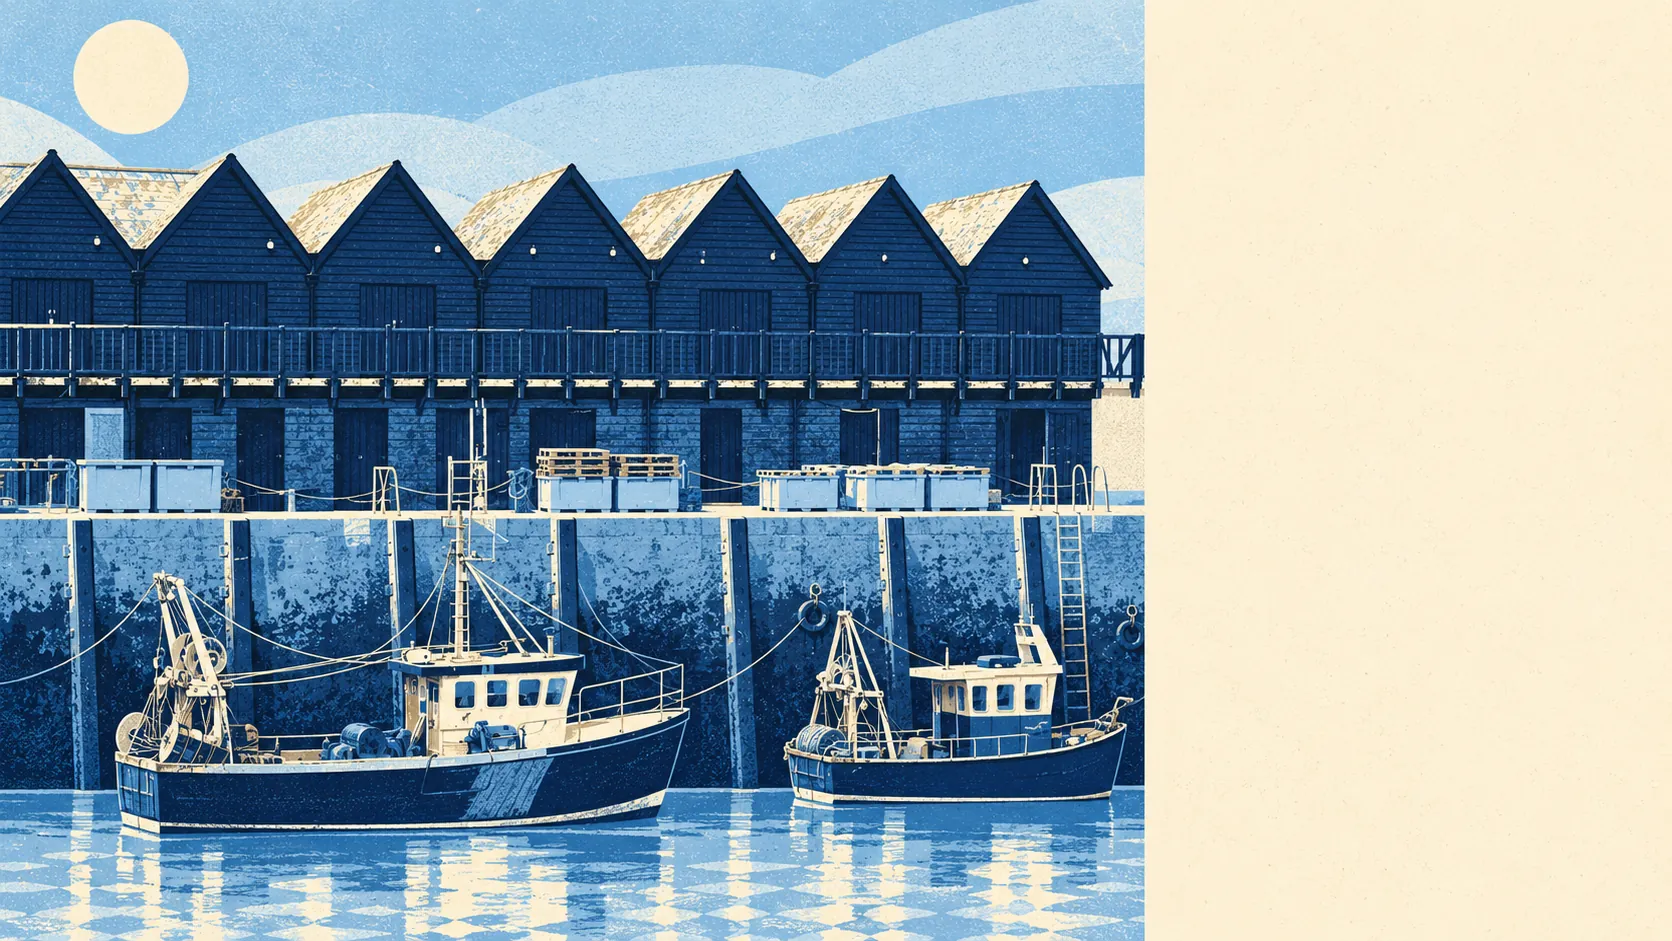
Yes, and the sea wall is working harder than the postcards let on. About one postcode in ten sits in the highest river-and-sea flood zone. A quarter rate high on at least one flood measure. The sea has come over the defences within living memory. Most of Whitstable stays dry; the part that does not is the part everyone photographs.
Start with rivers and the sea. The Environment Agency's flood zones put about 11% of the area's postcodes in flood zone 3, the highest-probability band, and a further 17% in flood zone 2, the medium-probability fringe that sits beyond it. The two are separate bands, not one inside the other. Much of the town centre is built on low-lying former marshland behind sea walls, which explains why the zones cluster where they do. The record backs it up: the Environment Agency holds 285 recorded flood events here, the latest in August 2007, from the sea, when the defences were overtopped.
Surface water is a separate problem with a long local history. The old Gorrell Backwater reservoir contributed to flooding in the town in 1897 and 1953, until the underground Gorrell Tank was built in the early 1970s with a car park on top. Drainage improvements move the risk; they do not remove it, and surface water is folded into the postcode-level figures further down rather than broken out on its own.
Looking forward, the climate-adjusted flood zone takes in about 35% of postcodes. That is the Environment Agency's view of how the zones grow once a changing climate is allowed for, and it is the figure a buyer on a twenty-five-year mortgage should care about more than today's map.
Insurance follows the map. A home inside the higher zones can expect more questions from insurers, higher premiums or a larger excess, and the time to find out is before an offer, not after exchange. An indicative quote on the exact address costs nothing and tells you more than the listing will.
At postcode level, and counting any flood source including surface water, about 25% of postcodes rate high on at least one measure, about 26% medium and about 50% low. These bands overlap with the flood-zone shares above; they are a different measure and should not be added to them.
Counting homes rather than postcodes, the Environment Agency's rivers-and-sea mapping lists 7,481 properties in postcodes that carry some risk. Of those, 561 are at high risk, 447 at medium, 2,008 at low and 2,895 at very low. Of the high-risk properties, 322 are homes. Postcodes with no risk at all do not appear in that count.
Then the question most flood summaries skip: is anything in the way? About 10% of postcodes fall inside the high-risk extent with no defence in the model, and about 4% fall inside it where a defence is present. "Defended" means a wall or embankment exists in the Environment Agency's model. It does not mean the house stays dry, and the 2007 overtopping is the local proof.
The water is close. About 39% of postcodes sit within 500 metres of the coast, the nearest just 13 metres from it, and the median postcode is about 640 metres away. That is a threshold across the area, not a verdict on any single front door.
The shoreline management plan for this stretch of coast is to hold the line, meaning keep the existing defences, over the next 20, 50 and 100 years. That is a stated intention from the authorities, not a guarantee of funding and not a new defence already built. Plans get revisited, and a policy does not stop a storm.
At Dover, the nearest tide gauge, sea level rose by about 2.2 millimetres a year over the record from 1961 to 2010. That is a measured historic rate, not a forecast, but it runs in one direction.
Flood risk is Whitstable's weak spot, and a real one: the higher ground is fine, the low-lying centre needs the flood search read line by line. Nobody should let a harbour view make that decision for them.