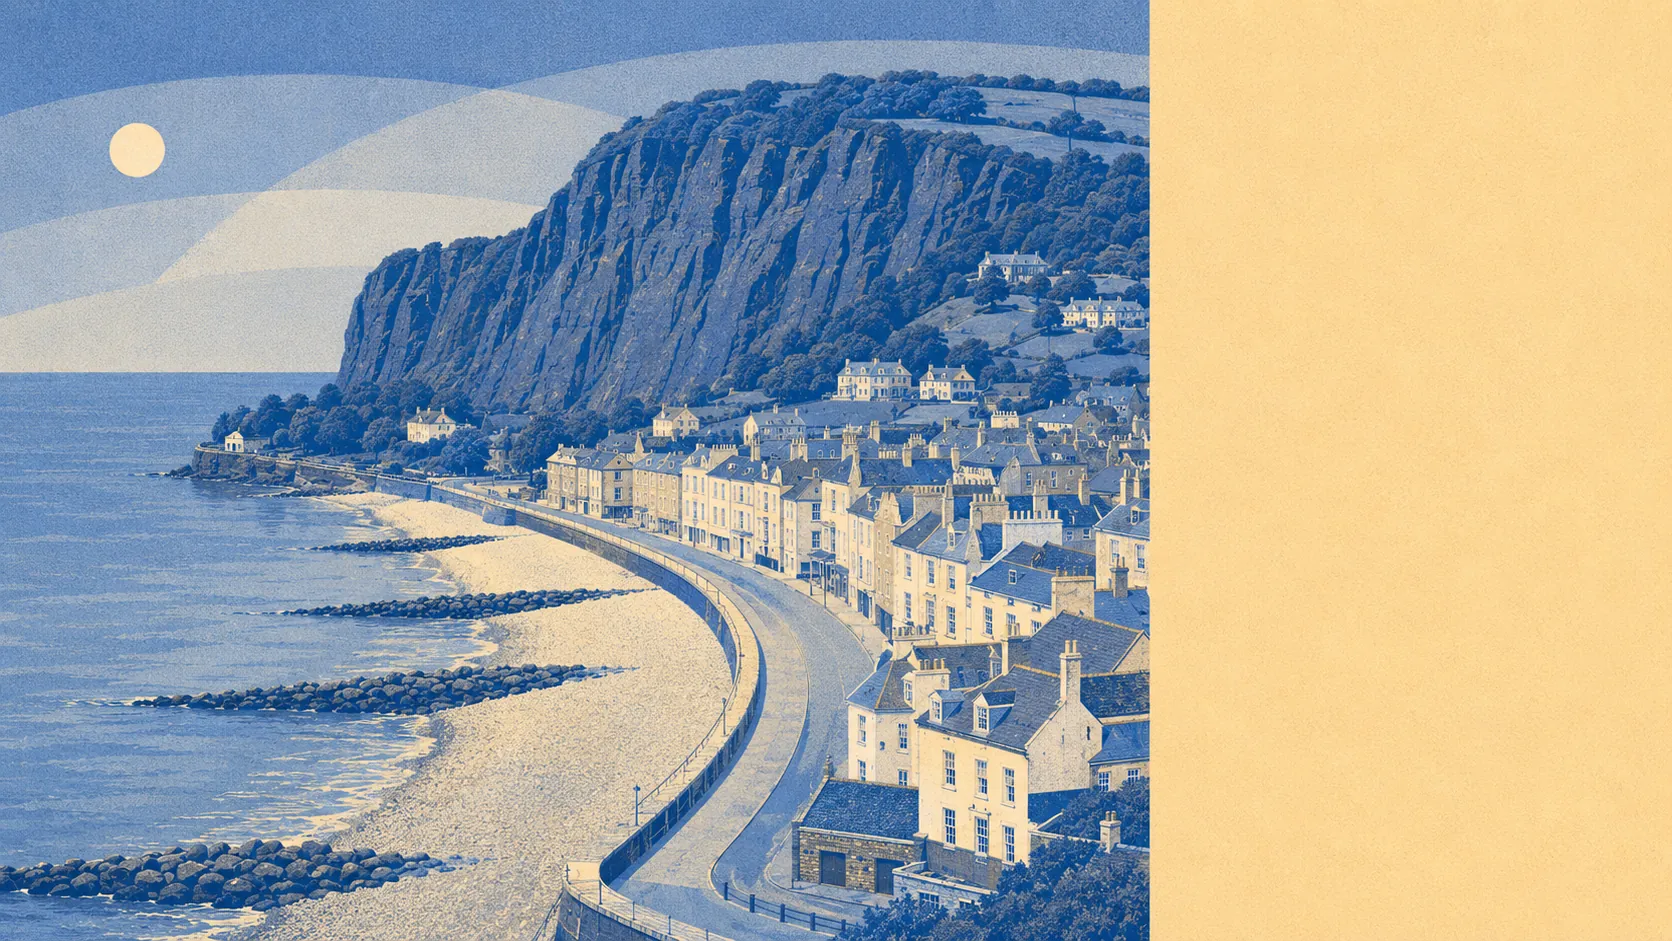
Yes, in parts, and which part decides everything. Around a tenth of the town sits in the highest river and sea flood zone. Several hundred properties carry a high risk rating on the rivers and sea mapping. The valley has a long recorded history of water coming down it. This is a question to answer at the address, not at the town.
Start with rivers and the sea. The Environment Agency's mapping puts about 10% of the area's postcodes in flood zone 3, the highest-probability band, and about 2% in flood zone 2. Those two are separate bands rather than one inside the other: zone 2 is the additional medium-probability fringe sitting beyond zone 3, which is why it is the smaller figure here. A town built where a river meets the English Channel between two hills was always going to concentrate its risk along one obvious line.
Surface water is not published as its own share for this area. The postcode-level indicators fold it in alongside rivers and the sea rather than separating it out, so there is no clean surface-water percentage to give. What the record does carry is history: 120 recorded flood events, the most recent in July 2012, logged against the main river with channel capacity exceeded and no raised defences involved. Roughly 9% of postcodes have a recorded historic flood behind them.
Looking forward rather than back, the climate-adjusted zone raises the share to about 12% of postcodes. That is the allowance the mapping already makes for a wetter century, and it is a modest widening rather than a redrawing of the town.
For insurance, this is the sort of profile that gets noticed. A high-risk address will attract questions, excesses and premiums that a mid-valley bungalow will not, and the difference can be large enough to change what a property is worth to you. Get an indicative quote on the specific address before you instruct a solicitor, not after the survey comes back clean on everything else.
Widen out to the postcode indicators, which combine surface water with rivers and sea, and about 23% of postcodes rate high on at least one measure, about 17% medium and about 35% low. Those bands overlap with the flood-zone figures rather than adding to them: the same street can appear in both counts. It is a coarse screen, useful for telling you whether a road deserves a closer look, useless for telling you what happens to a particular front door.
Counted as homes rather than postcodes, the Environment Agency's rivers and sea mapping lists 1,424 properties across the postcodes that carry any risk at all, of which 411 are rated high, 118 medium and 140 low. Of the high-rated ones, 250 are residential. Only postcodes carrying some risk appear in that list, so the total is not the town, it is the exposed part of it.
Whether anything stands between the water and the building varies. About 10% of postcodes sit inside a high-risk extent with no defence present in the model, and about 9% sit inside one where a defence is present. The second number is not reassurance. It means the model knows a structure exists, not that the structure is adequate, maintained, or built for the flood that eventually arrives.
The sea itself is close. About 26% of postcodes fall within 500 metres of the coast, the closest sits around 31 metres from it, and the median postcode is about a kilometre inland. Every postcode in the town is covered by a shoreline management plan, and the policy across the 20, 50 and 100 year horizons is to hold the line. That is a stated intention to maintain defences over those horizons. It is not a guarantee, and it is not the same as a defence already standing where you need one.
Sea level at the nearest gauge, at Devonport, rose at about 2.35 millimetres a year across the record from 1962 to 2015. That is a measured historic rate over a long record, not a forecast, and it is the context every one of the figures above sits inside.
Flood risk is the weakest thing about Sidmouth, and it is weak enough to reorder a shortlist rather than merely footnote one. The town is livable and the risk is concentrated, so the work is to find out precisely which side of that line your address falls on before anyone talks about offers.