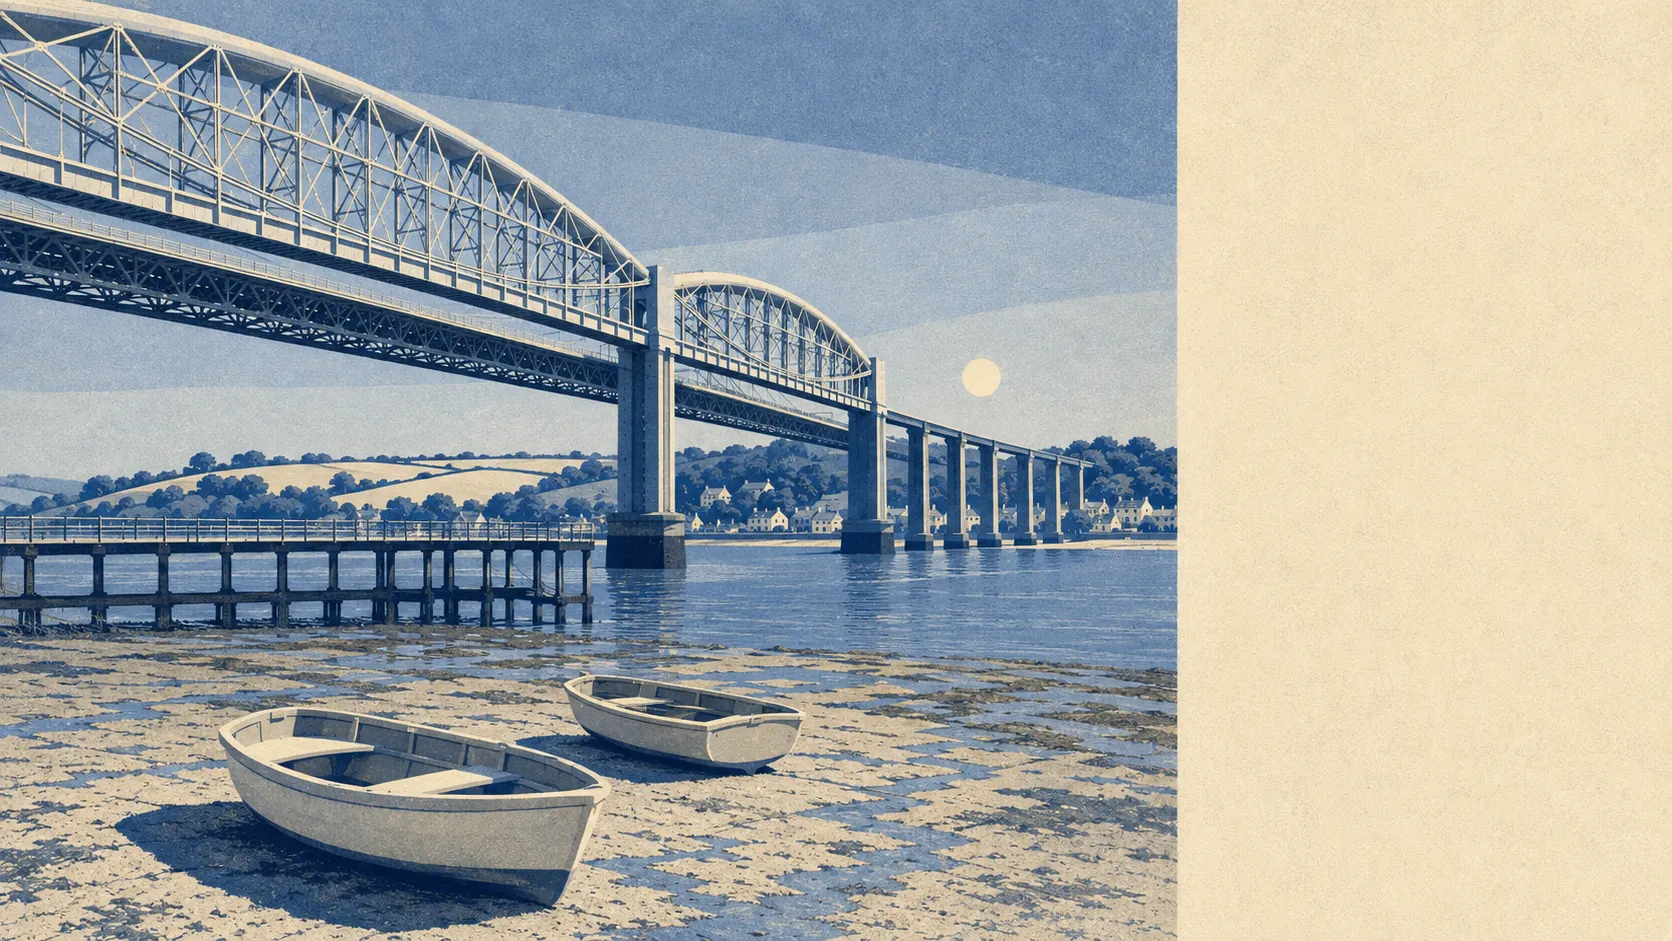
Mostly no, and the exceptions are close enough to the water that you can see them coming. Only about one postcode in a hundred sits in the highest river-and-sea flood zone. No historic flood extent is recorded anywhere in the town. Four in ten postcodes sit within five hundred metres of the coast. This is not a flooding town, it is a town with a waterfront, and the distance between those two descriptions is about a hillside.
Taking river and sea flooding first, the Environment Agency's mapping puts roughly 1% of the area's postcodes in flood zone 3, the highest-probability band, and roughly 1% again in flood zone 2. Zone 2 is the additional medium-probability fringe lying beyond zone 3 rather than a larger ring containing it, so the two bands are separate slices of the town and not one nested inside the other. Both are small, and both are concentrated where you would expect them to be.
Those zones do not measure surface water at all. Rain that runs off high ground and collects in the wrong dip is a different mechanism from a river coming over its banks, and a town that drops toward an estuary generates plenty of it. The broader indicator set covered further down this answer folds surface water in alongside rivers and sea, which is why it flags more of Saltash than the flood zones do.
Looking forward, the climate-adjusted flood zone extent covers about 2% of the area's postcodes. That is the mapping's allowance for a wetter future rather than a prediction about any particular decade, and it is still a small share of a town of this size.
For insurance, the practical consequence is that most Saltash addresses will be quoted as ordinary risks and a small number near the water will not. Anyone buying inside a mapped zone should get an indicative quote before instructing a solicitor rather than after, because the premium and the excess are the parts of flood risk that show up every single year regardless of whether the water does.
On the wider postcode-level view, which counts a postcode if it rates on at least one flood measure including surface water, about 9% of the town's postcodes rate high, about 8% medium and about 26% low. These bands overlap with the flood zone figures above rather than sitting alongside them, so they are a different lens on the same town, not an additional set of properties at risk.
Counted as homes rather than postcodes, the Environment Agency's rivers-and-sea mapping lists 253 properties across the 14 postcodes that carry any risk at all, with 34 at high risk, 9 at medium, 15 at low and 3 at very low. Of the high-risk properties, 19 are residential. Postcodes with no risk do not appear in that list at all, so this is the affected end of town described in full, not the town described in summary.
On whether anything stands between the water and the house, about 1% of postcodes fall inside the high-probability extent modelled without defences, and about 1% fall inside the extent modelled with defences present. Defended in this context means a defence exists in the model. It does not mean the property is protected, it does not describe the condition of that defence, and it should never be read as the reason to skip a survey.
The water is genuinely close. About 39% of the town's postcodes lie within 500 metres of the coast, a threshold the mapping defines rather than a statement about any one address, the nearest postcode sits about 4 metres from it, and the median across the town is about 630 metres. Every postcode here falls under a shoreline management plan, and the stated policy across the twenty, fifty and hundred year horizons is to hold the line. A policy is an intention to maintain defences over that period, not a guarantee that funding arrives and not evidence that a defence already stands where you are buying.
At the nearest tide gauge, at Devonport, the measured record from 1962 to 2015 shows sea level rising by about 2.35 millimetres a year. That is what was recorded over that period rather than a forecast of what happens next.
No historic flood extent is recorded across the town. That is genuinely reassuring, and it is also a record of what has been mapped rather than proof that no house here has ever taken water.
Flood risk in Saltash is middling, which is the correct answer for a town where the great majority of addresses are dry and a specific, mapped, countable minority near the water are not. The town-wide figure is close to useless for the individual buyer, so put the exact address into the Environment Agency's long-term flood risk tool before you fall in love with the view.