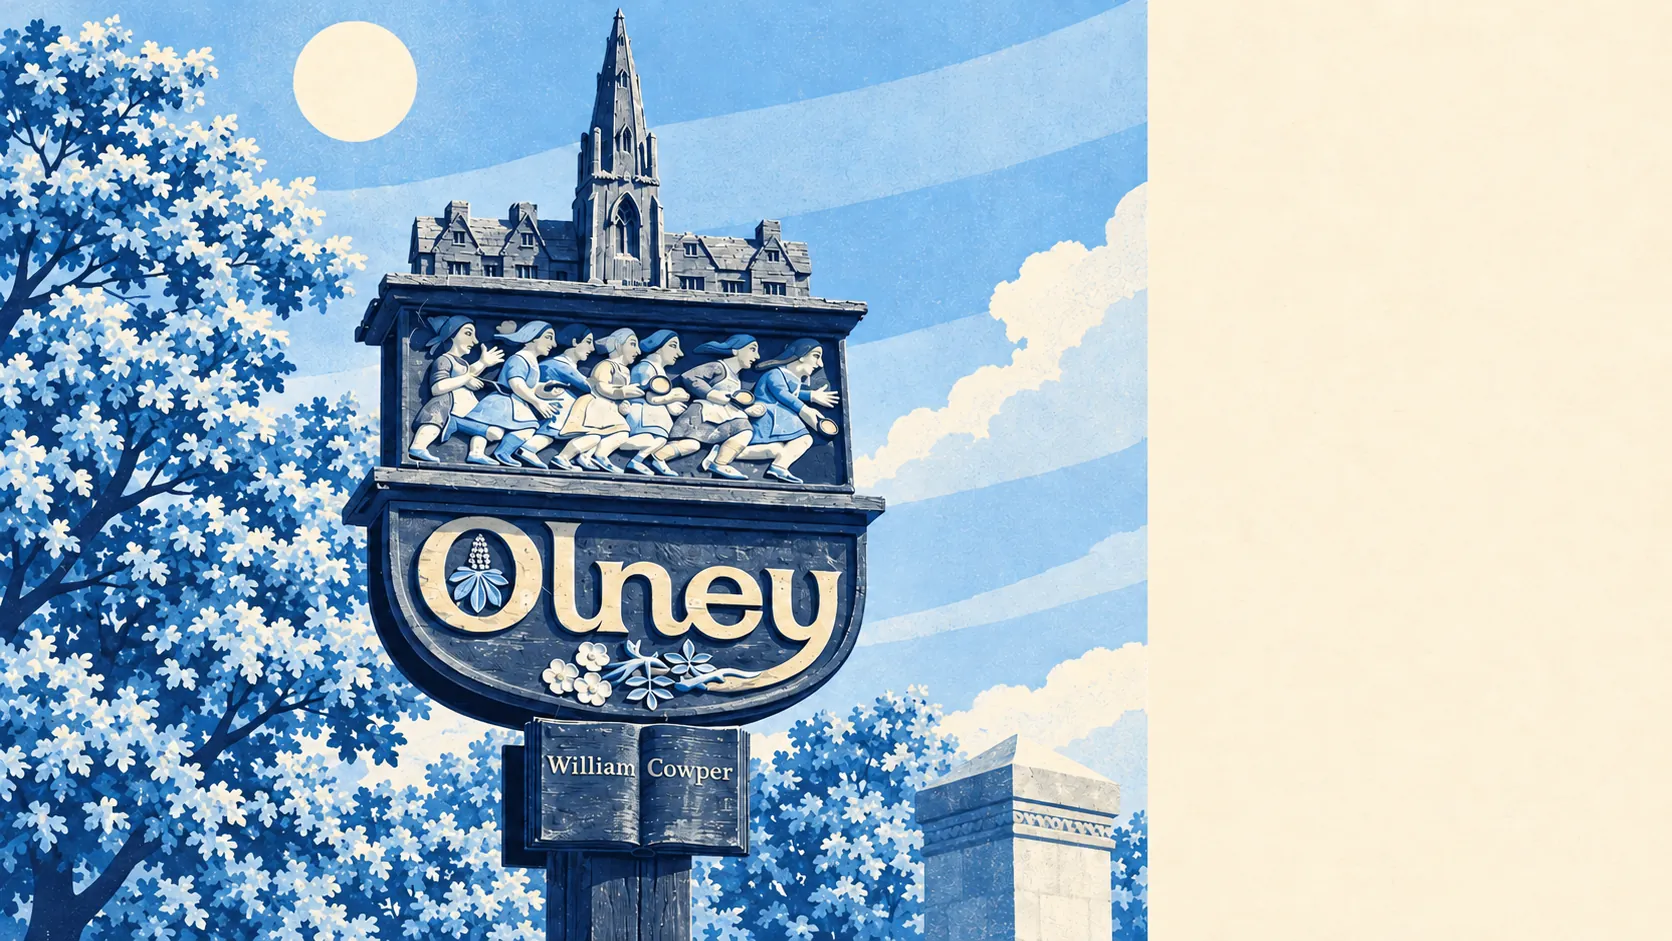
Olney is a lovely place to own a house you never intend to change, because the Olney area carries 491 listed buildings and the stonework outranks the homeowner. Crime runs well below the Milton Keynes average. Seven in ten households own their home. Almost half the workers never commute. The price of all that settled stone is asking permission before you touch any of it.
The listing count for the Olney area breaks down as 18 Grade I buildings, 16 at Grade II* and 457 at Grade II. Ten conservation areas fall within the same patch, among them Olney itself, Emberton, Lavendon, Ravenstone and Clifton Reynes, along with 21 scheduled monuments, including the Roman site at Olney and Olney Bridge. For a buyer, this is practical. Listed building consent covers changes inside a listed house as well as outside, and conservation-area status tightens the rules on demolition and on what the street can see. Replacement windows, a new roofline or a rear extension all become conversations with Milton Keynes City Council's planners. William Cowper's old house was handed to the town as a museum in 1905, and much of the High Street behaves as if it had been handed over too.
Safety is where the place earns its keep. Thames Valley Police figures for June 2025 to May 2026 give the Olney area a published rate of about 48 crimes per 1,000 residents, roughly 55% below the Milton Keynes average of about 107. Violence and sexual offences make up about 42% of recorded crime, against 35% nationally. That category is a broad legal grouping that includes common assault without injury, and it tops the list almost everywhere. Antisocial behaviour, at about 8%, runs at half the national share. The force's own record is less flattering: Thames Valley Police charged someone in about 9% of cases over the same year, against 12% across England and Wales, ranking 37th of 42 forces. That is a force-wide figure covering a much larger area than this one. The biggest recorded fight at Olney Bridge was Prince Rupert attacking the Parliamentarians in 1643, and the bridge has gone back to carrying traffic.
The Land Registry's last twelve months, to mid-May 2026, show 123 sales at a median of about £395,000. Detached houses went for about £550,000, semis for £340,000, terraces for about £319,000 and the 11 flats that sold for about £208,000. Band C is the most common council tax band, and only about 15% of homes are in bands A or B, so a cheap tax bill is as hard to find as a cheap house.
Renting is priced off a wider map. Across the whole Milton Keynes authority, the Office for National Statistics puts typical private rent at about £1,330 a month as of April 2026, with one-beds around £970 and four-beds around £2,080. A market town full of period houses on the edge of a new city can easily drift away from that average, and for once the city is the one doing the dragging.
The council tax valuation list, which covers every dwelling, shows a stock dominated by houses: about 36% detached, 25% terraced, 21% semi-detached, 9% bungalows and 8% flats. About 20% were built before 1930. Among homes with an energy certificate, about half reach band C or better, while 12% sit at E or worse. About 75% of homes are on mains gas, with 6% heating on electricity alone. Armstrong's 1928 lace factory on the High Street is apartments now, so even the flats here come with a listing-worthy past.
The people match the houses. About 71% of households own their home, the median age is 48, and the Office for National Statistics models median gross household income at about £67,000 for the year to March 2023, an estimate averaged across the area. About 46% of workers were based mainly at home at the last census. For a good share of Olney, the Milton Keynes commute is something that happens to other people.
Olney grew up at a ford on the Great Ouse, and its mediaeval bridge was only extended right across the flood-prone valley in the reign of Queen Anne. The Environment Agency's river-and-sea flood zones look kind now: fewer than 1% of the area falls in Zone 2 and none in Zone 3. The postcode measure, which counts surface water as well, tells a busier story. About 14% of postcodes carry a high rating on at least one flood indicator, 19% medium and 36% low. The two figures disagree because rain that never reaches the river still finds the road. Eleven flood events are on record, the latest in 1980.
Green space is close almost everywhere. The average home is about 210 metres from a park or open space, with around 18 within a kilometre, and water is about 340 metres away. Around Weston Underwood, Clifton Reynes and Cold Brayfield the fields start where the gardens stop. The town was recorded as Olla's island in 932, and the river has been setting the terms ever since.
Getting about takes a car. Passenger trains stopped in 1962, so the nearest stations are Wolverton and Milton Keynes Central, and under 1% of workers commuted by train. About 41% drove. The area has 124 bus stops averaging about 18 weekday departures each, roughly one bus an hour at peak, connecting to Lavendon, Newport Pagnell and Central Milton Keynes. Department for Transport modelling from 2019 puts the nearest hospital about 25 minutes away by car and 55 by public transport, and the bus figure has had seven years to get worse. Broadband is better connected than the roads: gigabit service reaches about 87% of premises and superfast 95%. Newton Blossomville, Chicheley and Turvey are all part of the same picture.
Olney is right for people who want somewhere safe and settled, work mostly from home and already like the house they are buying. It is wrong for anyone whose plan involves knocking through, adding a glass box at the back or catching a train from the end of the road. In this town the extension you have in mind is a proposal the conservation officer gets to answer. Take on a house you are happy to keep as it is, and Olney is a better place to live than most people manage to find.