Yes, though the risk is mostly from rain rather than rivers. Very few homes are in a river flood zone. About a quarter of postcodes rate high on at least one flood measure. The gap between those two figures is surface water. A flood zone map of Morden is mostly clear, which isn't the same as the area being dry.
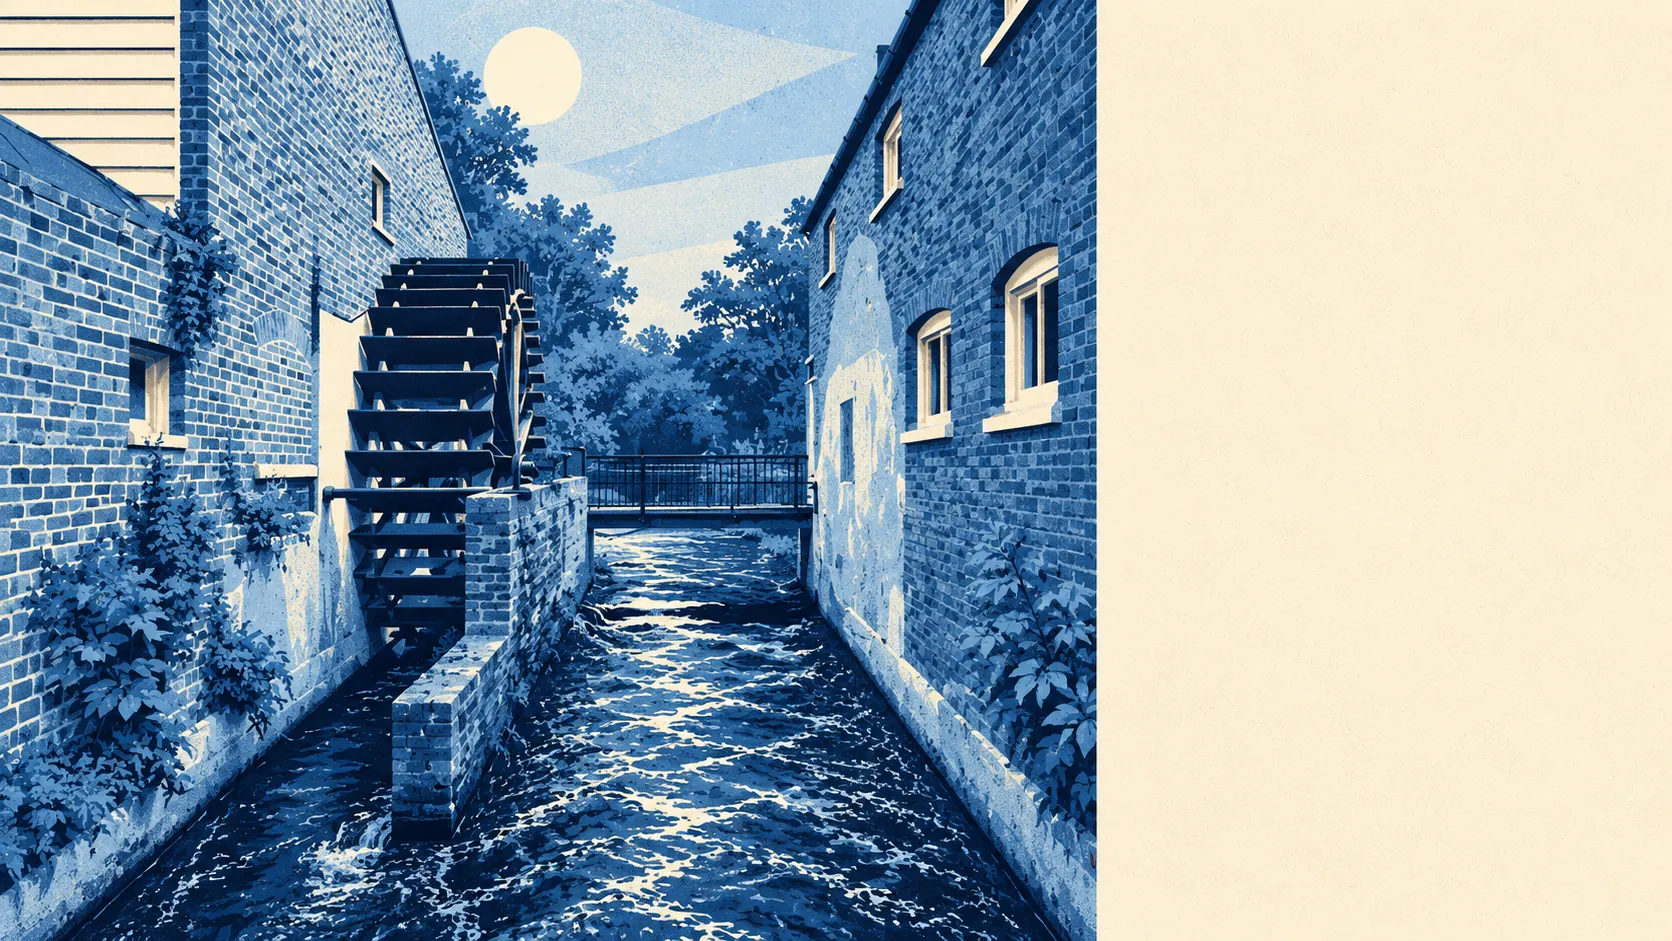
On the Environment Agency's river-and-sea flood zones, about 5% of Morden's postcodes are in zone 2 and about 1% in zone 3. The two zones don't overlap. Zone 3 is the highest-probability band, and zone 2 is the medium-probability band around it, which is why zone 2 can be the larger figure. The agency holds six recorded flood events for the area. The most recent was in 1968, when a main river with no raised defences overflowed its channel. The River Wandle once powered snuff mills here, and these days it rarely makes the news.
Most of Morden's flood risk comes from surface water. A heavy downpour runs off roofs and roads faster than the drains can take it away. The river zones don't measure this at all, so a house can be well outside zone 2 and still have water reach the front step. Put the exact address into the Environment Agency's long-term flood risk service and read the surface-water result as well as the river one. Most of the risk shows up in the surface-water result.
Allowing for climate change, the Environment Agency's projected river-and-sea zone covers about 2% of postcodes. That is a modest extension of the current zone 3, with most of the change on streets already near the edge of the zones.
Most homes in Morden can be insured on normal terms, but a house on a postcode with a high surface-water rating may cost more to cover, or come with a larger flood excess, than its neighbour higher up the same road. Ask a broker for a quote on the specific address as early as you can, ideally before paying for a survey.
Measured by postcode, with surface water included alongside rivers and sea, 25% of Morden's postcodes rate high on at least one flood measure, 28% medium and 49% low. These bands overlap with the flood zones above and measure something wider, so don't add the two sets of figures together.
The property count is the most useful figure. The Environment Agency's rivers-and-sea mapping covers 1,840 properties on the 61 Morden postcodes it flags with any risk at all. Of those, 34 are at high risk, 100 at medium and 653 at low. Postcodes with no risk are left out of that mapping, so the 1,840 is only the properties with some exposure, not every property in Morden. Thirty-four is a small, specific number. What matters to a buyer is whether the house they are viewing is one of them.
The Environment Agency's flood-extent model puts about 1% of postcodes in the high-risk extent without defences and about 1% with defences. In the model, "defended" only means a defence exists. It doesn't mean the street behind it stays dry. On the low-risk extent without defences, the share rises to about 6%.
The nearest tide gauge is at Portsmouth, where the sea has risen at about 2 millimetres a year over its record from 1962 to 2023. The only reason that figure appears on a Morden page is that Portsmouth happens to have the nearest gauge to a South London suburb. Sea level has nothing to do with Morden's risk.
Flood risk is Morden's weakest point, and almost all of it comes from rainwater that the drains can't clear, with very little from the river or the sea. For most streets that is manageable. For the few dozen houses in the high-risk band, it decides whether to buy.