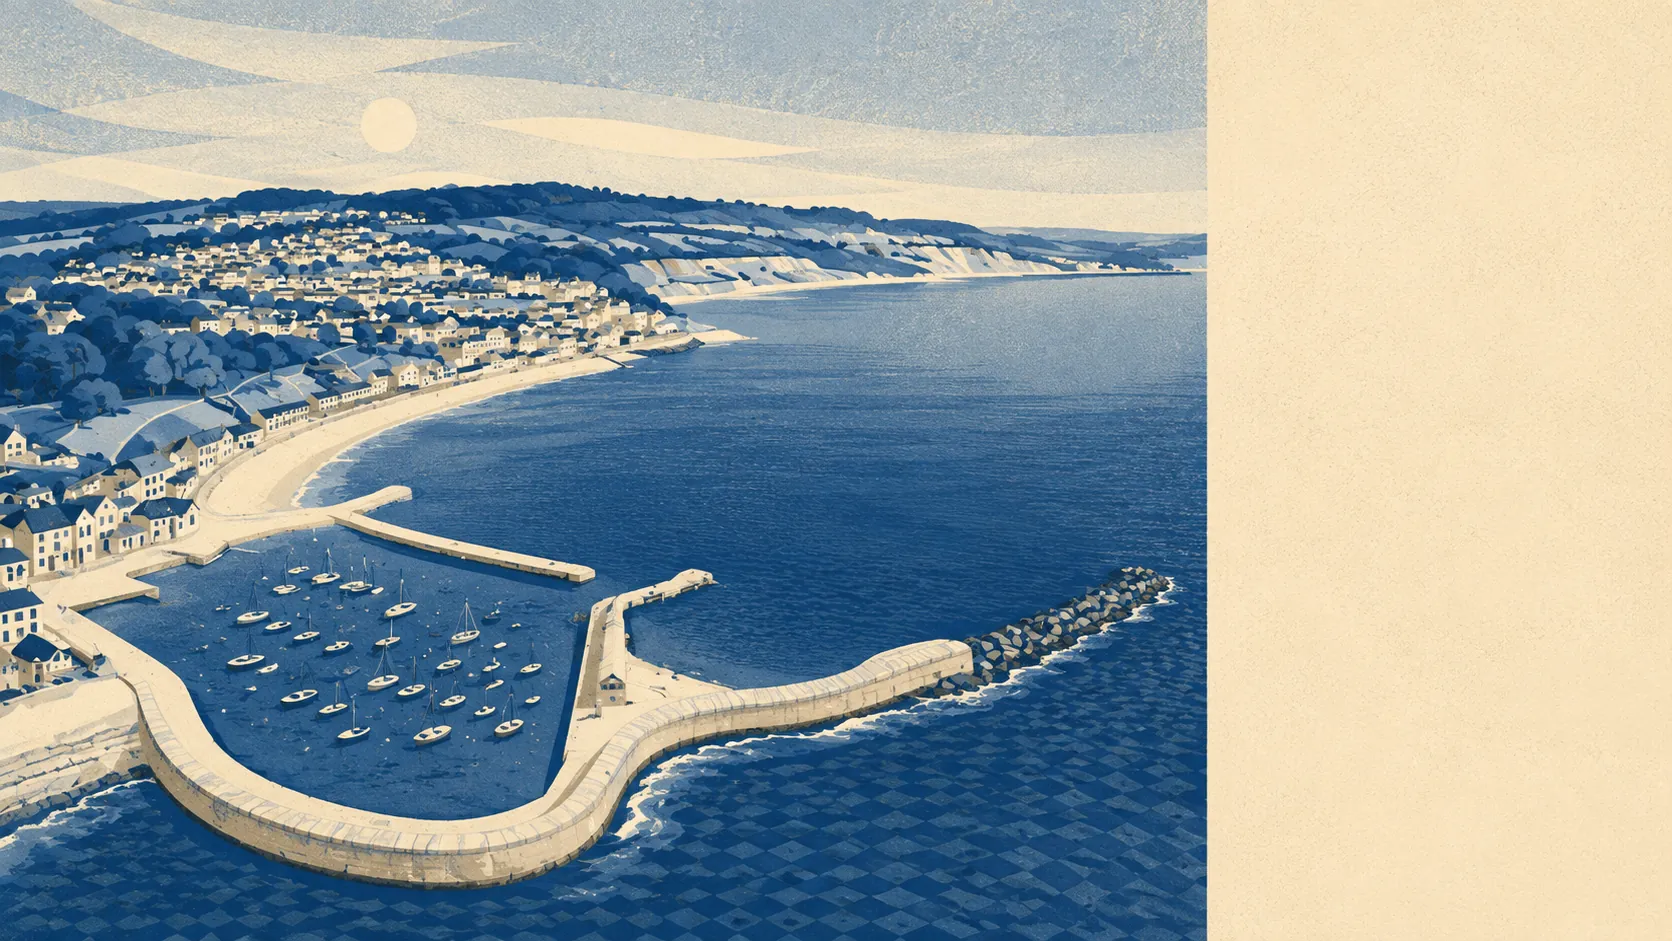
Yes, in patches, and the patches are the ones with the view. Roughly half the town's postcodes sit within five hundred metres of the sea. The closest gets to within sixteen metres of it. The formal flood zones cover a small slice of the place, while the broader risk indicators cover a good deal more. Most of Lyme Regis is dry and intends to stay that way. The part that isn't is precisely the part people move here for.
Start with rivers and the sea, which is what the Environment Agency's flood zones actually measure. About 4% of the town's postcodes sit in zone 3, the highest-probability band, and about 2% in zone 2. Zone 2 being the smaller number is not an error: it is the additional medium-probability fringe lying beyond zone 3, not a wider circle drawn around it. So on the river-and-sea measure alone, this is a coastal town with a contained problem rather than a general one.
Surface water is the risk those zones do not cover, and it is the one that catches people out. Rain that arrives faster than the drains can take it does not care which zone a house sits in, and a town built where a river runs down to the sea gets both kinds of water in the same weather. That component is folded into the postcode-level indicators rather than published as its own share here, which is why those indicators run well ahead of the zone figures.
Look forward and the zone picture widens. With a climate allowance applied, about 9% of the town's postcodes fall inside the modelled flood extent, more than double the current zone 3 share. That is a modelling scenario rather than a forecast of any particular decade, but it is the number a buyer planning to hold a house for thirty years should be looking at rather than today's.
For insurance, none of this makes cover impossible, and all of it makes cover a question to settle before exchange rather than after. A high-risk address means the insurer wants the specifics, and the specifics are address-level rather than street-level in a town this steep. Get an indicative quote on the actual property while the survey is still pending, not once the mortgage offer is in.
On the postcode indicators, which fold surface water in alongside rivers and the sea, about 15% of the town's postcodes rate high on at least one measure, about 10% medium, and about 34% low. Those bands overlap with the zone figures rather than adding to them: a postcode can appear in both, and the higher number reflects the wider set of things being counted, not a bigger problem than the zones describe.
Counted as homes rather than postcodes, the Environment Agency's rivers-and-sea mapping lists 344 properties across the 21 postcodes that carry any risk at all. Of those, 87 sit at high risk, 30 at medium and 61 at low. The high-risk figure includes 30 residential properties, so the bulk of what sits in the firing line is not somebody's house. In a working harbour town that is roughly what the geography would predict.
Whether anything stands between the water and the building is the question most flood summaries skip. About 4% of postcodes sit inside a modelled high-risk extent with no defence present in the model, and about 4% inside one where a defence is present. Another 6% sit in a low-risk undefended extent. Present in the model is not the same as safe: it means a structure is accounted for in the modelling, not that it will hold, and not that it was built for the sea level a buyer will be insuring against in twenty years.
The coast itself is close. About 49% of postcodes lie within five hundred metres of it, the nearest reaching sixteen metres, with the median address around five hundred metres back. Every postcode here is covered by a shoreline management plan, and its stated policy across the twenty, fifty and hundred year horizons is to hold the line. That is an intention to maintain defences, recorded by the authorities responsible. It is not a guarantee of funding, and it is not evidence that a defence already exists at any given point.
At the nearest tide gauge, at Devonport, sea level rose at about 2.35 millimetres a year across the record from 1962 to 2015. That is a measured historic rate over half a century, not a projection of what the next fifty years do.
One genuinely good number: no postcode in the town falls inside a mapped historic flood outline. That is a real absence rather than a technicality, and it is worth something. It is also a record of mapped events, which is not the same as proof that nothing has ever come over the wall.
Flood risk here lands in the middle: real, mapped, and concentrated in a small and entirely predictable set of streets. The house you buy either has the problem or it doesn't, and the town-wide figure will not tell you which.