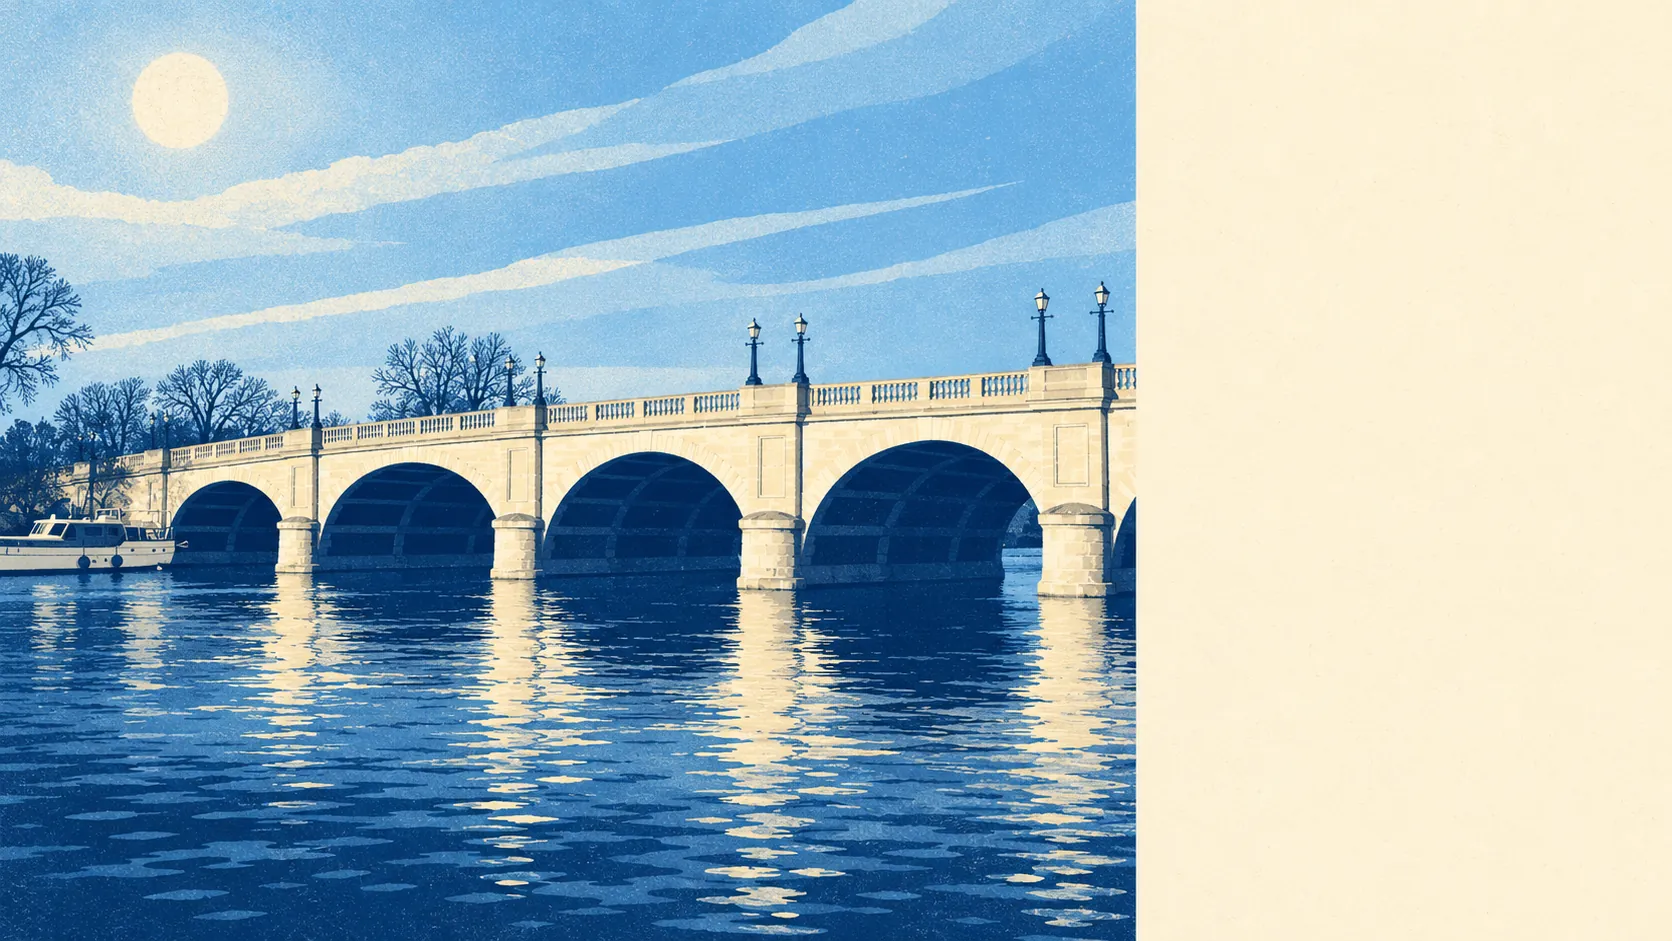
Yes, and the river is the reason the town exists. A quarter of Kingston is in the highest river flood zone. Another fifth is in the zone just beyond it. Half its postcodes carry at least a medium risk on one measure or another. Kingston was built where the Thames was easy to cross, and the Thames has never let it forget.
The Environment Agency's river-and-sea flood zones put about 25% of Kingston's postcodes in Flood Zone 3, the highest-probability band, and about 21% in Flood Zone 2. The two zones are separate bands: Zone 2 is the medium-probability fringe lying beyond Zone 3, so the figures stack side by side, and between them they take in close to half the postcodes. Kingston grew up at the first crossing point of the Thames upstream from London Bridge, with the Hogsmill River running into it on the south side of the old market, so the low ground by both rivers is where the zones concentrate.
Surface water, the flooding that comes from heavy rain with nowhere to drain, is not mapped as a separate share for Kingston on this page; it is folded into the postcode-level measures further down. What is recorded is the history. About 18% of postcodes fall within the Environment Agency's outlines of past floods, and its register holds 128 recorded flood events, the most recent in February 2014.
The Agency's climate-adjusted mapping, which redraws the zones for higher future river flows, puts about 54% of Kingston's postcodes inside them. That is a planning allowance for what the river may do, used by the council when it decides where new homes can go, and it is the figure most likely to matter to whoever buys the house from you.
Insurance follows the maps. A home in Flood Zone 3, or one with a past claim, can face higher premiums, a large flood excess or a shorter list of insurers willing to quote. Get a buildings insurance quote on the exact address early in the process, and ask the seller in writing whether the property has ever flooded or claimed for it. For a flat, the cover usually sits with the block, so the question goes to whoever manages the building.
Measured another way, by postcode on at least one flood indicator with surface water included alongside rivers, about 16% of Kingston's postcodes rate high, 34% medium and 42% low. These bands overlap with the flood zones above and are a different measure entirely, so the two sets of percentages should never be added together.
Counted as homes and other buildings, the picture gets more concrete. The Environment Agency's rivers-and-sea mapping lists 6,767 properties in Kingston's at-risk postcodes, of which 1,187 are rated high risk, 1,490 medium, 3,048 low and 21 very low. Of the high-risk properties, 1,042 are homes. Only postcodes carrying some risk appear in that count, so the thousands of properties on higher ground are not in it at all. The Downs it is not; Kingston's high ground is mostly the far side of the one-way system.
The question most buyers never ask is whether anything stands between the water and the house. In the Agency's modelling, about 26% of Kingston's postcodes fall inside the high-risk extent with defences left out, and about 27% with defences included. "Defended" means a defence is present in the model. It describes a wall or a bank on a map, and says nothing about whether the water stays on the right side of it on the night.
The nearest tide gauge on record for Kingston is at Portsmouth, where sea level rose by about 2 millimetres a year between 1962 and 2023. That is the rate measured at a coastal gauge a long way from Kingston, and on its own it says little about a town whose risk comes down the river.
Flood risk is one of Kingston's weaker points: real, mapped and concentrated on the low ground near the water. Buyers who want the river close should price the insurance in alongside the view.