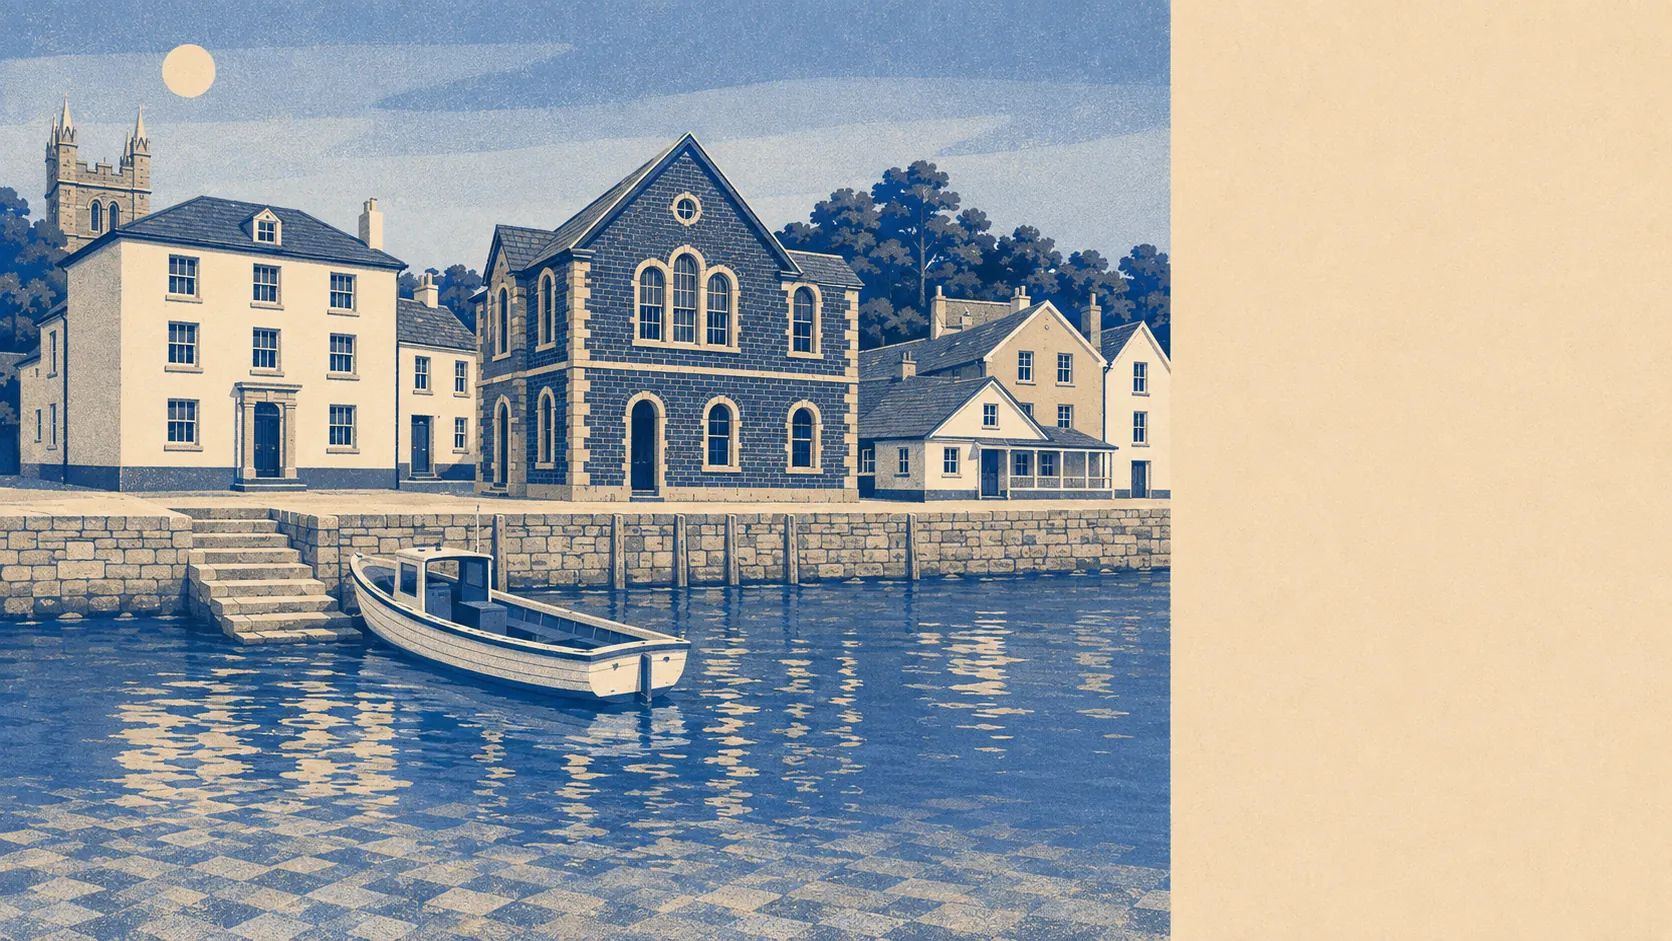
About £450,000 buys the typical house in Fowey, which is what happens when a working harbour becomes a place people retire to on purpose. Detached is where the serious money sits. Flats and semi-detached houses are the cheaper way in. Barely three dozen homes change hands in a year. This is not a market so much as a small run of individual decisions, most of them made by someone who fell for the water first and did the arithmetic afterwards.
In the year to May 2026 the Land Registry recorded 35 sales here, with a median of £450,000. Detached houses accounted for 16 of them at a median around £551,500. Terraces made up eight sales at about £390,000, flats six at about £340,000, and semi-detached five at about £310,000. The semi-detached figure sitting below the flat figure is the sort of thing that happens when five sales carry a whole category, so read the type-level numbers as indications rather than as a price list.
Direction of travel is gentle. The house price index covering this area was up about 4% over the twelve months to May 2026, and slipped a fraction of a percent in the final month. Flats went nowhere over the same year, a fraction of a percent lower than they started. Nothing in that is a boom or a correction. It is a market moving at the speed of a place where 35 houses a year is a busy twelve months.
Council tax lands most commonly in band C, and about 27% of dwellings sit in bands A or B, so a good number of homes are billed well below what their sale prices would suggest. A band D property in this area pays about £2,590 a year. Cornwall's valuation list was drawn up on 1991 values and Fowey has spent the intervening decades becoming considerably more fashionable, which is why the band and the asking price so often look like they belong to different towns.
Renting is only measured at county level, so the figure to work with is the typical private rent across the Cornwall area, about £1,000 a month, up around 5% over the year. That comes from the Office for National Statistics price index and is a mean across the county rather than a median of advertised listings, so treat it as the shape of the market rather than the price of anything you will actually be shown. By size, the county typical runs at about £690 a month for a one-bed, £880 for a two-bed, £1,080 for a three-bed and £1,510 for four bedrooms or more. Nothing in that accounts for a view of the estuary, which is the thing everyone is really bidding on.
On affordability, gross household income here was modelled at about £44,600 for the financial year to March 2023, before tax and before anything else. Set that against a median sale near £450,000 and the conclusion writes itself: local earnings are not what is buying most of these houses. Equity from somewhere else is, along with people whose working life happened in a more expensive postcode and ended here.
Measured by floor space, the sales that could be matched to an energy certificate came out at a median of about £4,460 per square metre, on a typical floor area of 114 square metres. That covers around 60% of the sales in the period, so it is the price per square metre of the homes that can be measured, not of every home sold.
The bedroom mix from the 2021 census explains why the floor areas look the way they do. About 37% of households have three bedrooms and 30% have two, with roughly 27% at four or more and about 6% in one-bed homes. Fowey is a town of ordinary family-sized houses at prices that stopped being ordinary some time ago.
As value goes, Fowey is middling. You are not being fleeced, but the money is buying the estuary, the conservation grid and the view, and the bricks are largely coming along for the ride.