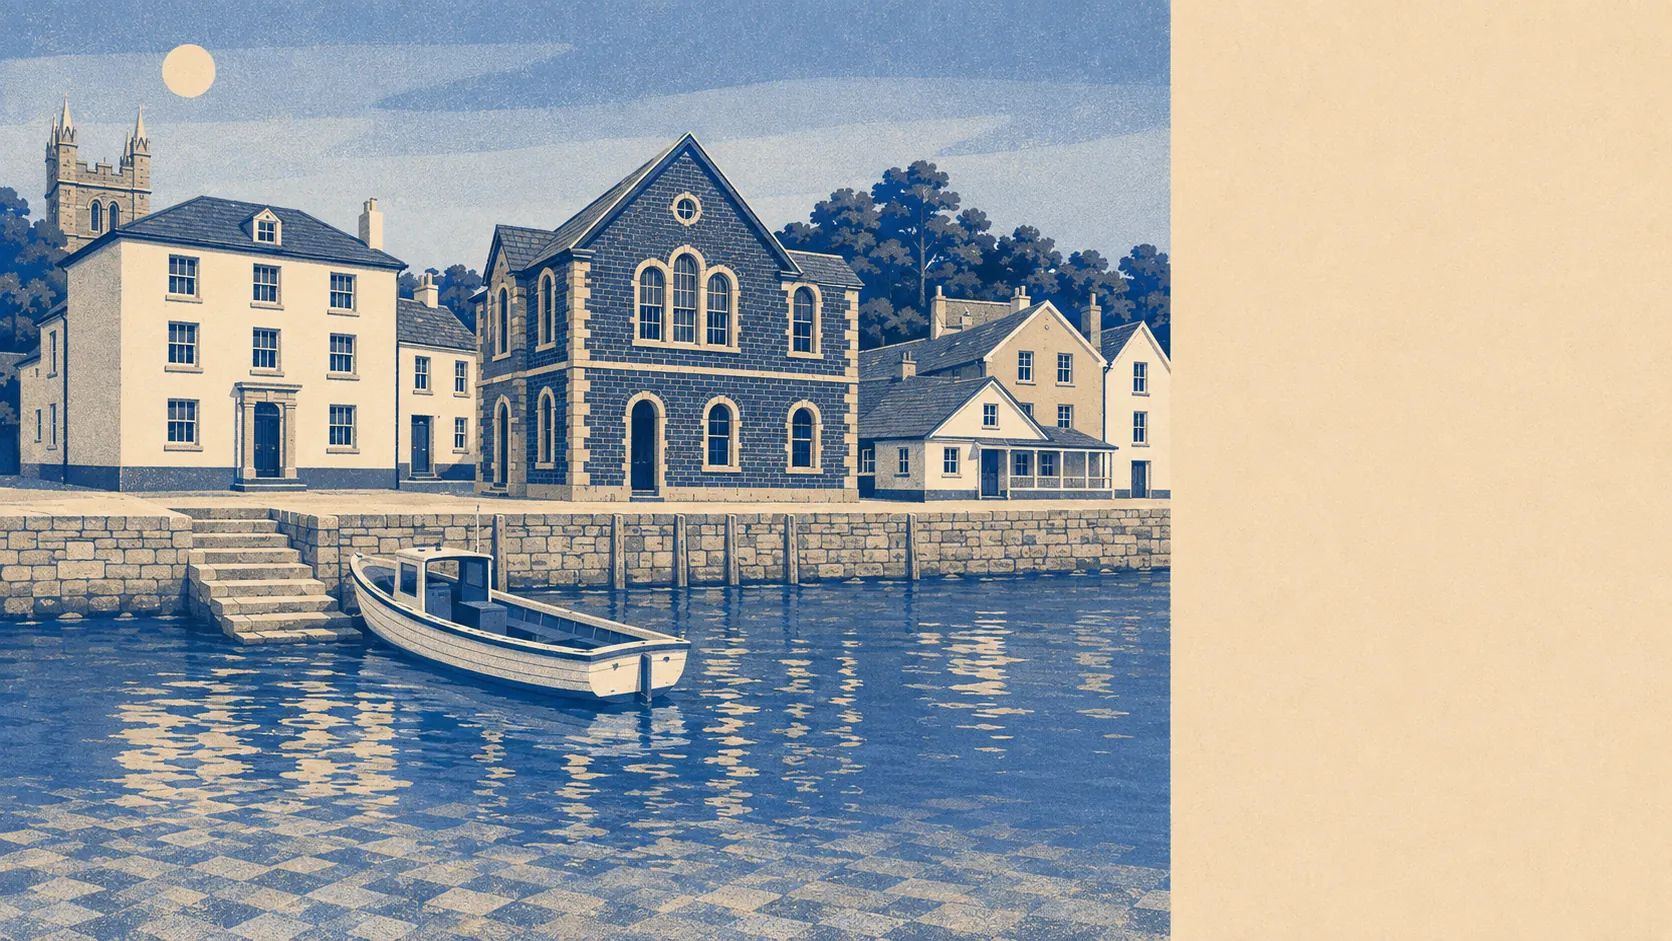
Yes, in the places you would expect, which in a town built around a working harbour is more places than most buyers want to hear. Roughly one postcode in five carries a high flag on at least one flood measure. Three quarters of them sit within a few minutes of open water. The whole shoreline is covered by a policy of holding the line. Fowey's setting and Fowey's flood risk are the same fact viewed from two directions, and no amount of estuary light changes that.
Start with rivers and the sea, because that is the measure lenders and insurers reach for first. On the Environment Agency's flood zone mapping, about 7% of the area's postcodes sit in zone 3, the highest-probability band, and about 1% in zone 2. Those two bands are separate rather than nested: zone 2 is the additional medium-probability fringe lying beyond zone 3, which is why it is the smaller of the two here. The town's exposure is concentrated at the bottom of the hill, where the town has always been.
Surface water is a different problem with a different map. It does not appear in the flood zones at all, and it is folded instead into the broader postcode indicator set. In a town where the streets run downhill into a harbour, that distinction matters: heavy rain does not need a river to reach a front door, it just needs a gradient and a blocked drain, and Fowey supplies the gradient.
The forward look is worse than the current one. Under the climate-adjusted zone, which allows for higher sea levels and heavier rainfall, about 21% of postcodes fall inside the mapped extent. That is not a prediction about any given winter. It is the mapping's own statement of how much more of the town comes into scope once the allowance is applied.
For insurance, this is the part of the purchase that needs doing early rather than late. A high-risk address changes premiums, changes excesses, and occasionally changes which lenders will proceed. Get an indicative quote before instructing a solicitor, not after. The Flood Re scheme can help make cover available for eligible homes, but it does not cover properties built since 2009, and it does not cover the excess conversation you will still have with an insurer.
Across all measures combined, including surface water alongside rivers and sea, about 22% of the area's postcodes rate high on at least one indicator, about 14% medium and about 39% low. Those bands overlap with the flood zone figures rather than adding to them, and they describe postcodes rather than houses.
Houses are the more useful unit. The Environment Agency's rivers-and-sea mapping lists 18 postcodes here carrying some level of risk, covering 325 properties in total, of which 71 are at high risk, 14 at medium and 47 at low. Of the high-risk properties, 23 are residential. Postcodes with no risk at all do not appear in that list, so the figures describe the exposed part of the town rather than the whole of it.
On defences, the modelling is blunt. About 7% of postcodes fall inside the high-risk modelled extent with defences accounted for, and about 7% fall inside it without them. Defended in this context means a defence is present in the model, not that a house behind it is dry. The extent does not shrink when the defences are counted, which is worth sitting with.
The water is close by design. About 76% of postcodes lie within 500 metres of the coast, the median distance is around 142 metres, and the closest gets to within seven metres. That 500 metre figure is a threshold the mapping uses, not a description of any single address.
Every postcode here sits under a shoreline management plan, and the policy at the 20, 50 and 100 year horizons is hold the line. That is a stated intention to maintain defences over those periods, decided by people who will not be around for the hundred-year version. It is not a guarantee, and it is not a defence that necessarily exists yet.
At the nearest tide gauge, at Devonport, the measured record from 1962 to 2015 shows sea level rising at about 2.35 millimetres a year. That is what was recorded over that period, not a forecast, and it is the slow variable sitting underneath every other number here.
Flooding is where Fowey scores worst, and honestly so. The exposure is real, it is concentrated rather than general, and it varies so sharply between one street and the next that the only number that matters is the one attached to the specific address.