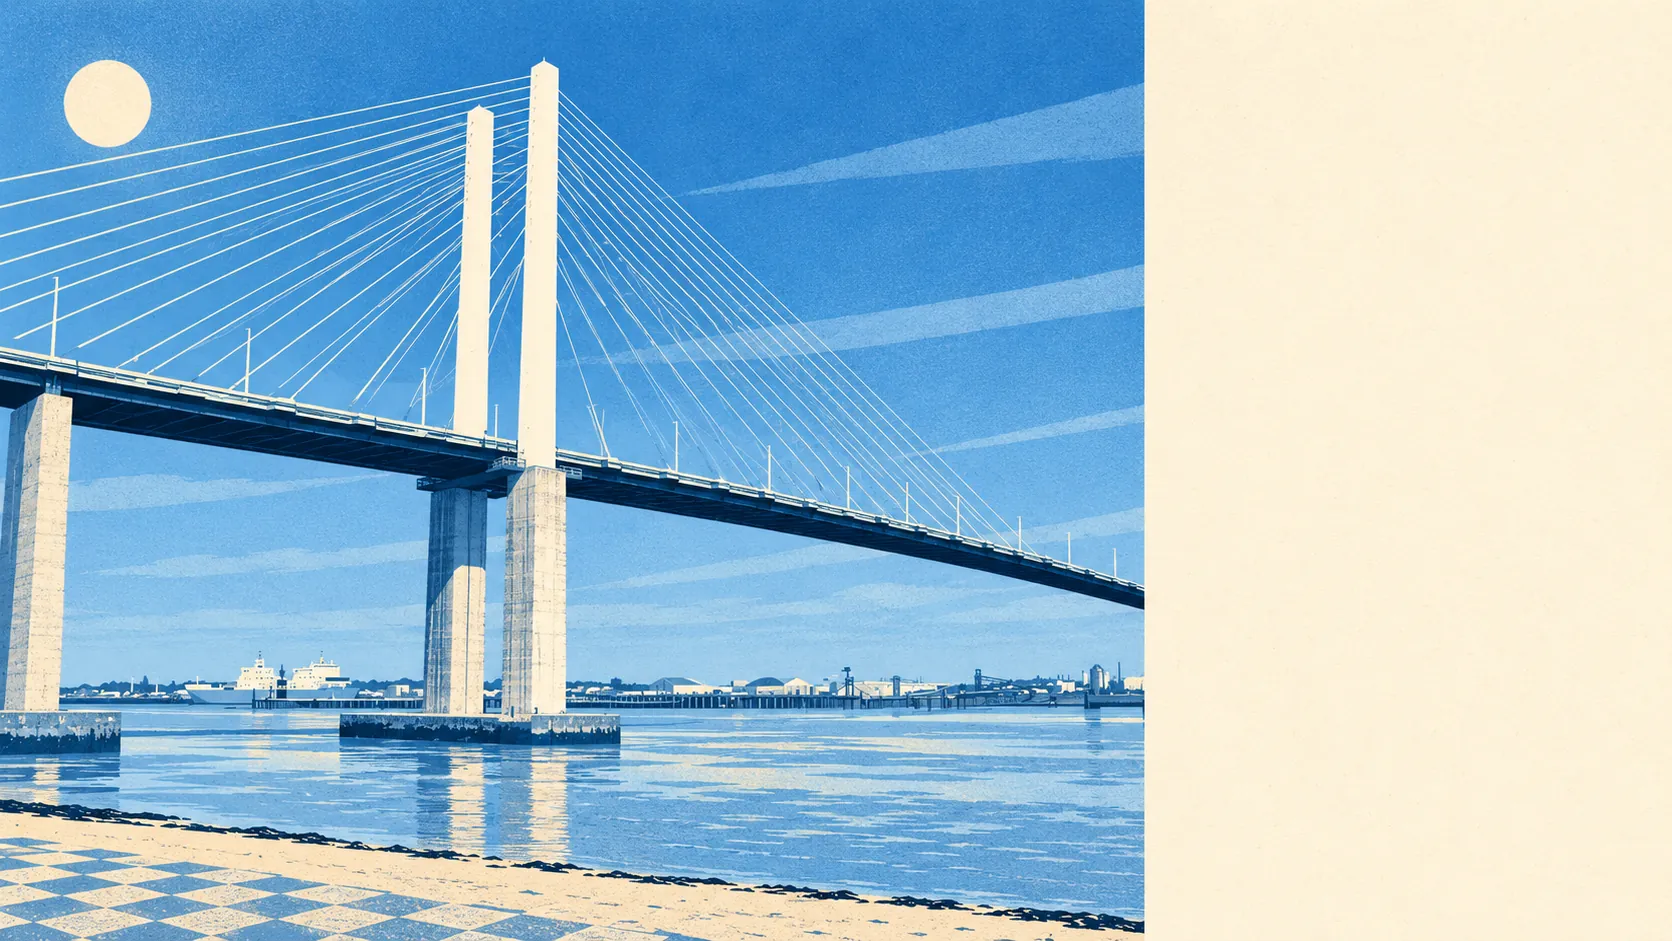
Dartford has a real flood risk, but it is concentrated on the low ground by the Thames and the marshes. About one postcode in ten is in the highest river-and-sea flood zone. Most of the town is built on higher chalk. Allowing for climate change, the share in the flood zones roughly doubles. The town is named after the spot where people had to wade across the river, so the risk has never been a secret.
On the Environment Agency's river-and-sea mapping, about 10% of Dartford's postcodes fall in flood zone 3, the highest-probability band, and another 6% in flood zone 2. The two bands don't overlap. Zone 2 is the medium-probability fringe outside zone 3, which is why it can be the smaller figure. The exposure follows the geography. The Darent and the Cray meet on the low-lying Dartford Marshes north of the town, on London Clay and silt left by the rivers, while the town centre and the Darent valley stand on chalk.
Rain falling on the town is a separate risk from the rivers. The Environment Agency's river-and-sea flood zones leave it out entirely. The only measure here that counts it is the postcode-level one below, so a home well outside zone 3 can still have a surface-water problem.
The Environment Agency's climate-adjusted mapping puts about 23% of Dartford's postcodes inside its flood zones. That is a modelled scenario of how the zones could spread under a changing climate. Nobody has redrawn the map yet.
For insurance, the line between a postcode on the marsh edge and one up the chalk slope matters more than anything said at a viewing. Homes in the higher zones can face larger premiums, higher excesses or fewer insurers willing to quote, while most of the town should insure normally. Put the exact address into the Environment Agency's long-term flood risk check, then ask an insurer for a quote while the survey is still being booked.
Taking a broader set of measures, which counts surface water alongside rivers and sea, about 14% of Dartford's postcodes are rated high on at least one, about 17% medium and about 38% low. A postcode only has to fail one test to count. That makes this measure wider than the flood zones, and it is meant to be.
The Environment Agency's property-level mapping for rivers and sea counts 5,151 properties in Dartford postcodes that carry some risk, and postcodes with no risk are not listed at all. Of those properties, 170 are at high risk, 137 at medium, 2,295 at low and 1,071 at very low. That gives a clearer sense of scale than a share of postcodes. The high-risk group is a few streets, not the whole town.
About 3% of Dartford's postcodes are inside the high-probability flood extent with no defence in the Environment Agency's model, and about 1% are inside it with a defence present. "Defended" means a wall or embankment appears in the model. It does not mean the water stays out. Of the 104 floods on the agency's record, the most recent came off the sea in December 1993, when the water went over the defences.
The nearest tide gauge, at Dover, measured sea level rising by about 2 millimetres a year between 1961 and 2010. That is what the gauge recorded over those years, and the Thames does not owe anyone a repeat of the same rate.
Dartford's flood risk is middling. The large majority of the town is fine, and a band of low ground by the marshes and the river is not, so the street you buy on decides which side of that line you are on.