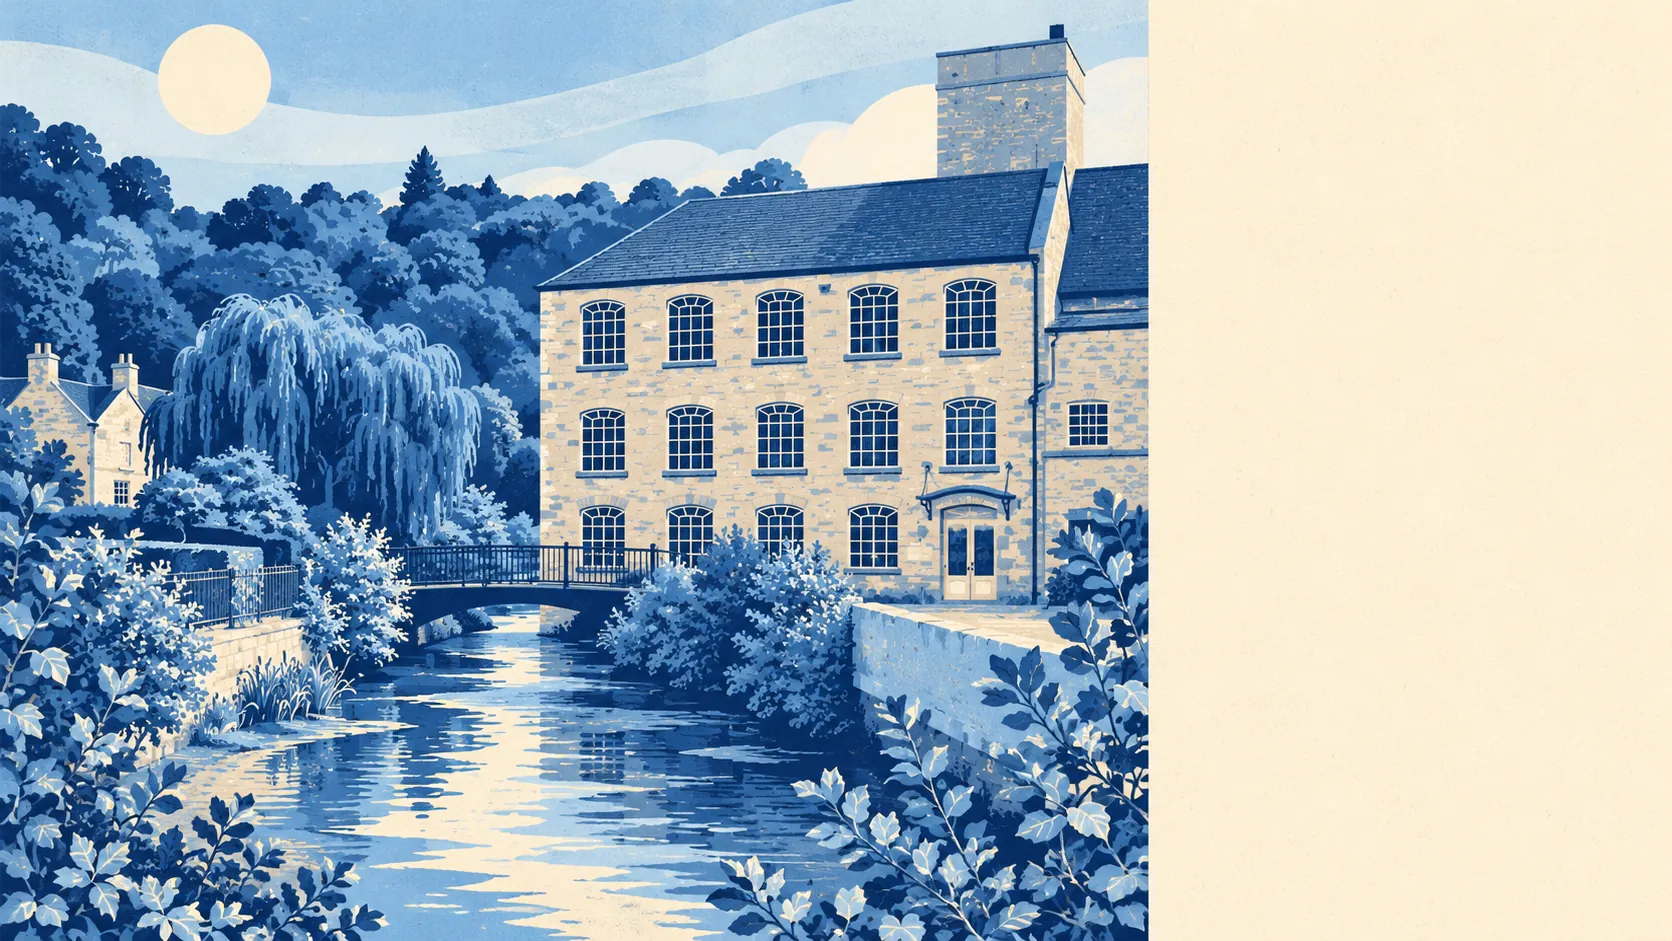
Brimscombe and Thrupp has a real flood risk, and almost all of it is in one place. The mills were built down by the water because they needed it. The homes on the valley floor carry most of the risk and the homes up the slopes carry very little. There is no recorded history of flooding to point to, and the mapping still marks a clear strip at risk.
About 8% of the area's postcodes are in the Environment Agency's flood zone 3, the highest-probability band for flooding from rivers and the sea, and about 1% more are in zone 2, the medium-probability fringe just beyond it. The two bands don't overlap, so the fringe here is narrow. In a narrow valley the river has almost no flat land to spill onto, so the line between at risk and not at risk is short and sharp.
Rain that falls on a narrow valley ends up at the bottom of it, and the roads down the slopes carry it there. The Environment Agency's flood-zone mapping only covers rivers and the sea, so surface water is left out of it and only shows up in the postcode measure further down.
The Environment Agency's climate-change projection widens the zone 3 share to about 12% of postcodes. The Frome needs more room in that projection, and the extra room comes from the same valley floor where the mills stand.
Insurers price a valley-floor house differently from one halfway up the hill, and that gap can matter as much as the asking price. Getting an insurance quote on the exact address early on is the one check worth doing here, because in this village two houses a few hundred metres apart can get very different quotes.
On a wider postcode measure, which flags a postcode if any one of several indicators puts it at risk, surface water included, about 11% of postcodes here rate high, 6% medium and 11% low. One postcode can trip several indicators at once, so this measure and the river-zone shares overlap and should be read separately.
The Environment Agency's rivers-and-sea mapping lists 29 postcodes here that carry some risk, covering 550 properties. Of those, 144 properties are at high risk, 83 of them homes, with 58 at medium risk, five at low and 41 at very low. Any postcode with no risk at all is left out of that list, so the 550 counts the exposed properties only and is far smaller than the whole village. A count of 144 properties is easier to picture than a share of postcodes, and it shows the risk is in a handful of streets and the rest of the village is clear.
About 8% of postcodes fall inside the high-risk extent when the model runs without defences, and about 8% when it includes them. The defences in the model don't shrink the high-risk area at all. Anyone describing a house here as defended is using a word that changes nothing on the Environment Agency's map.
The nearest tide gauge with a long record is at Portsmouth, where sea level rose by about 2 millimetres a year between 1962 and 2023. Portsmouth is a long way down the map from a Cotswold valley, and the danger here is the river and the rain, with the sea playing no part.
The Environment Agency has no recorded flood event inside the area. That is reassuring, but it only covers what was mapped and kept, and a valley that drove four centuries of water mills will have seen high water at some point.
Flood risk here is middling. The village is mostly dry and the risk is on the valley floor, so buyers on the slopes have little to worry about and anyone near the river needs that insurance quote.