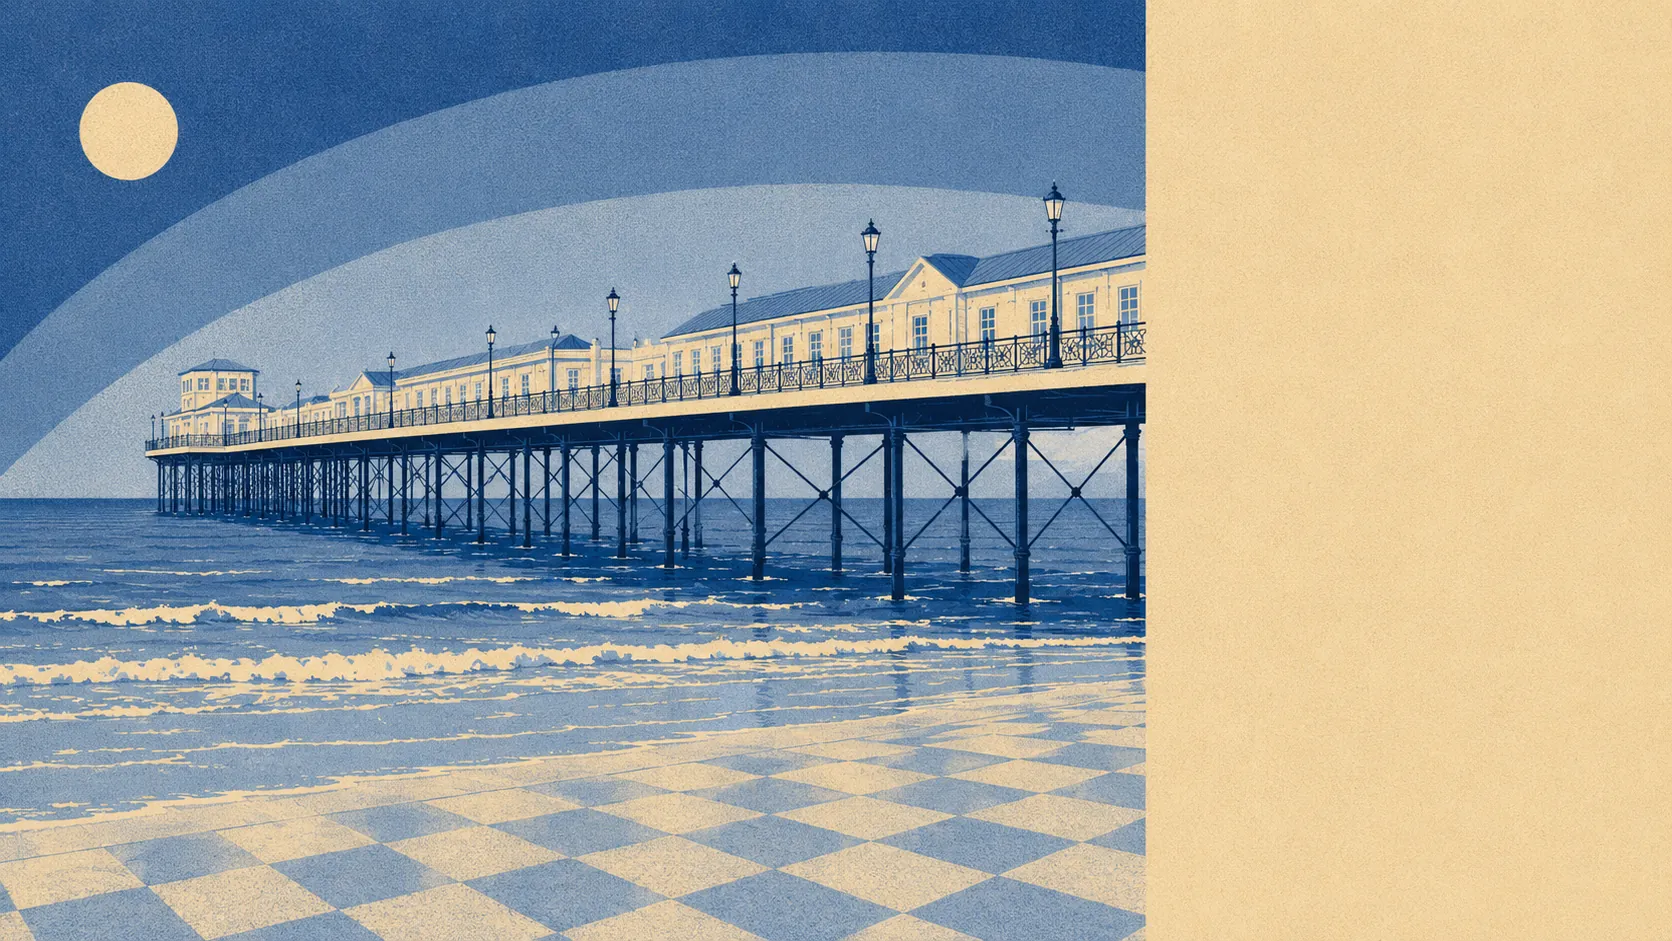
Yes, if you can live somewhere that stopped auditioning years ago. Two in three households own their home. The median resident is closer to fifty than forty. Green space starts about a hundred and fifty metres from most front doors. What Paignton lacks in polish it makes up for in the thing people actually move to the coast for, which is being outside.
Start with what you would be buying. On the council-tax valuation list, which covers every dwelling in the area rather than just the ones with a recent energy certificate, flats make up around 26% of the stock, terraces 22%, semis 19%, bungalows 19% and detached houses 13%. That bungalow share is the tell: this is a place built for people who did not want stairs, and it has been building for them for decades. Around 23% of dwellings went up before 1930, so the pre-war stock is a real presence without dominating. On energy performance, the Environment Department's certificate register puts around 43% of certificated property in band D and about 42% in bands A to C, with roughly 15% in band E or worse. Around 79% of homes run on mains gas and about 10% are electric-only, which is the number to check before you view rather than after: an electric-only older flat behaves very differently on a January bill from the gas-fired semi three streets over.
Prices are the reason people from up-country keep opening property apps at eleven at night. The Land Registry's last twelve months to late May 2026 record 780 sales in Paignton at a median of about £255,000. The spread by type is wide: flats around £142,000, terraces around £220,000, semis around £270,000, detached houses around £371,000. That flat figure is the one that reframes the town. There is very little of coastal England where a flat trades in the low one-forties, and Paignton has enough of them that the market has depth rather than a handful of oddities. Council tax lands mostly in band C, with about 41% of dwellings in bands A and B combined, which is a low-band town by any English standard.
For renting, the typical private rent across the Torbay area runs to about £900 a month. That is a local-authority figure covering Torquay and Brixham as well as Paignton, so treat it as the shape of the market rather than a quote for a specific street.
On safety, the published crime rate is about 93 offences per thousand people over the twelve months to May 2026, which sits roughly 15% below the Torbay average. That is a rate calculated on its own population base rather than something to work out from a headline count, and the direction of it matters more than the number: a seaside town with a busy visitor season and a lot of licensed premises usually reads worse than its residential neighbourhoods actually are. Paignton reads better than the borough it belongs to.
Schools are the quiet strength. Ofsted has graded 22 settings in the Torbay authority, of which 20 are good or better and two are outstanding, with none rated inadequate. Key Stage 2 maths across the 16 schools in these postal districts averages a scaled score of about 105, and Key Stage 4 attainment across the six secondary schools averages about 53. Paignton Academy and Churston Ferrers Grammar School Academy sit within reach, along with the grammar schools over in Torquay, and the primary picture is dense enough that most addresses have several options inside a short walk. The Department for Transport's modelling puts the typical primary school about ten minutes away on foot and a secondary about 28 minutes, which is the difference between a school run and a commute.
Connectivity is better than the town's reputation and worse than its geography deserves. Paignton Rail Station sits close to the town centre with services up the Riviera Line, and Torre, Torquay and Newton Abbot stations are all in range, but only around 1% of residents commute by train and about 56% drive. There are 522 bus stops in the area, 438 of them carrying service data, averaging around 37 scheduled weekday departures each, and roughly 73% of stops see a weekend service, which is unusually good for a town this size. Broadband is genuinely excellent: gigabit-capable connections reach around 90% of premises, superfast around 97%, and no premises sit below the universal service obligation. About 21% work from home, and that is the group the broadband was built for.
The coast is the environmental headline in both directions. On the Environment Agency's postcode indicators, which include surface water as well as rivers and sea, about 10% of postcodes carry a high rating on at least one measure and around 22% a low one. Narrow it to the river-and-sea flood zones and the picture is smaller: roughly 3% of the area sits in zone three and about 2% in zone two, rising to around 8% once climate allowance is applied. Radon is worth a mention, since about 77% of the area sits in the higher radon bands and the maximum recorded band here is the highest one, which means a radon test rather than a radon panic. Against that, green space averages about 160 metres from a postcode with roughly 20 sites inside a kilometre, and water is on average about 481 metres away. Coastal policy across the area is hold the line at every horizon modelled.
Heritage rules are the constraint people underestimate. There are 313 listed buildings in the area, five of them grade one and ten grade two star, and ten conservation areas including Polsham Park, Belgravia, Roundham and Paignton Harbour, Tormohun and Torre, with Cockington and Galmpton out on the edges. If your address falls inside one of those boundaries, window replacements, render, solar panels and anything visible from the street become a conversation with the council rather than a weekend job. Two identical houses either side of a boundary line live under completely different rules, and the boundary is not always where you would guess.
The character of the place follows from all of it. Around 68% own their homes, the median age is about 48, and modelled household income runs to roughly £45,000 a year before tax. That is a settled town rather than a churning one. The neighbourhoods this page covers stretch that character in useful directions: Goodrington down towards the sands, Marldon inland with a village feel and a different price tag, Collaton St Mary out on the Totnes side with more space and fewer pavements.
Paignton suits people who want coast and garden without a second mortgage, retirees and near-retirees who have done the maths on bungalows, remote workers who need the broadband more than the railway, and families who care that the schools nearby are mostly good. It suits anyone who would rather be twelve minutes from a beach than twelve minutes from a wine bar.
It does not suit commuters who need a fast train, buyers hunting capital growth on a short horizon, or anyone who wants to buy a period house in a conservation area and then do whatever they like to it. Torquay is the louder neighbour with more of everything, and Brixham is the working harbour with the tighter stock. Both are genuine alternatives, and which one fits depends on whether you want the noise, the boats, or neither.
Paignton is above average, and the shape of that is specific. Its real strength is what surrounds it: green space at the end of most streets, water in every direction, a coast path that runs for hundreds of miles, and schools that mostly do their job. The weak spot is the freedom to alter your own home, because the listed buildings and the conservation area boundaries mean a meaningful slice of the housing stock comes with a planning officer attached. Buy in the right pocket and you get the sea and the garden for money that would embarrass most of the south coast. Buy the wrong one and you spend three years arguing about windows.