Mostly no, though the rain gets a vote. Only a sliver of New Malden lies in the river's worst zone. About one postcode in seven carries a high flag on some measure. The last recorded river flood is decades old. The risk here falls from the sky more often than it climbs out of the river.
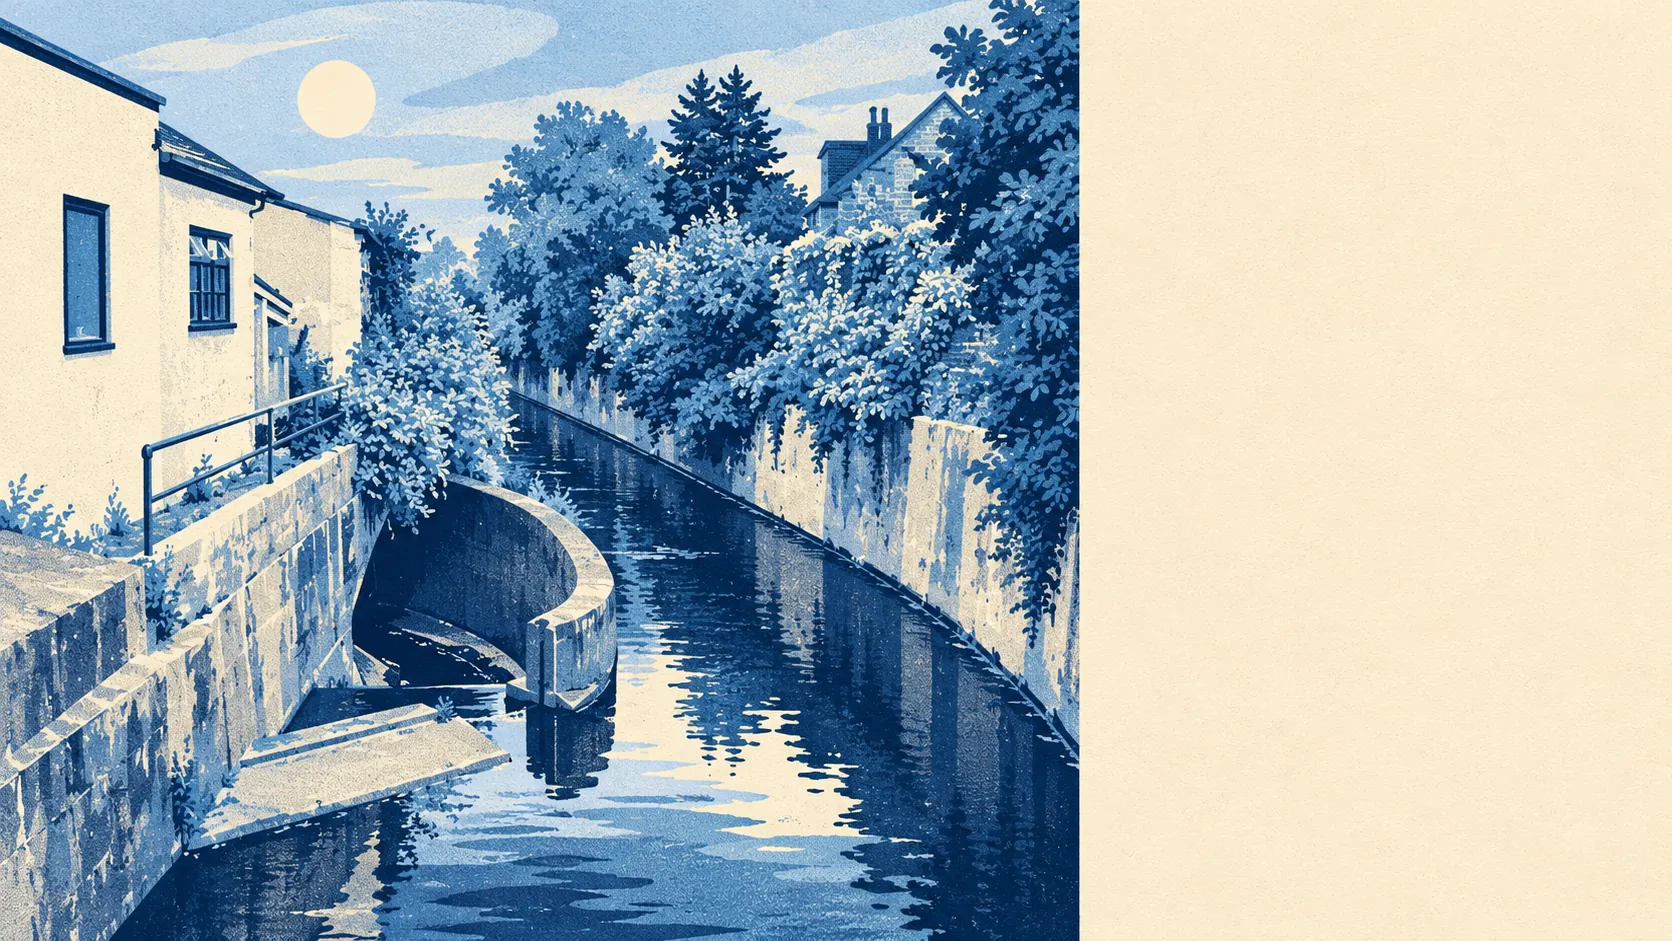
On the Environment Agency's river-and-sea flood zones, about 1% of New Malden's postcodes are in Zone 3, the highest-probability band, and about 9% are in Zone 2. The zones do not overlap. Zone 2 is the medium-probability fringe beyond Zone 3, so the bigger number here belongs to the milder risk, which is the opposite of how most buyers read it. The river in question is the Hogsmill, which runs along much of the border with Berrylands.
The Environment Agency holds 49 recorded flood events for the area, and about 6% of postcodes have a flood on record. The most recent came from a main river in September 1968, when the channel ran out of room and there were no raised defences to stop it. Since then the history is mostly the history of heavy rain. Interwar streets of semis, paved drives and patios give a downpour fewer places to soak in than the farmland they replaced.
Looking forward, the Environment Agency's climate-adjusted flood zone covers about 4% of New Malden's postcodes. That is a model of how the zone could change under a warmer climate, with no date attached to any of it.
For most of New Malden, flood risk should make little difference to buildings insurance. For homes on the flagged streets it can mean higher premiums, a bigger excess or fewer insurers willing to quote. Get a buildings insurance quote for the exact address early on, because an insurer's quote is the flood map with a price on it.
Counting postcodes that rate on at least one flood measure, rivers, sea and surface water included, about 14% of New Malden's postcodes come out high, 21% medium and 50% low. These bands overlap with the zone figures and use a different method, so they cannot be added together. Half the postcodes carrying a low flag mostly means half the postcodes have drains and weather.
Homes are a more useful count than postcodes. The Environment Agency's river-and-sea mapping lists 133 New Malden postcodes with some risk, covering 3,771 properties. Of those, 114 properties are at high risk, 173 at medium and 1,517 at low. Of the 114 high-risk properties, 96 are homes. Postcodes with no river or sea risk at all do not appear in that count.
The defences question has a short answer. In the Environment Agency's modelled flood extents, about 2% of New Malden's postcodes fall in the high-risk extent with defences left out, and about 2% with defences included. Whatever stands along the river is not shrinking the worst band in the model. "Defended" only means a defence is in the model. It does not tell you whether the defence keeps the water out.
The nearest tide gauge is at Portsmouth, where the sea rose by about 2 millimetres a year on average between 1962 and 2023. That is the rate the gauge measured over those years, and it says nothing about what the rate will be next. New Malden has plenty to think about, but the sea can be left to Portsmouth.
Flood risk in New Malden is middling. Most streets are clear, a few hundred properties are not, and the rain matters more than the river.