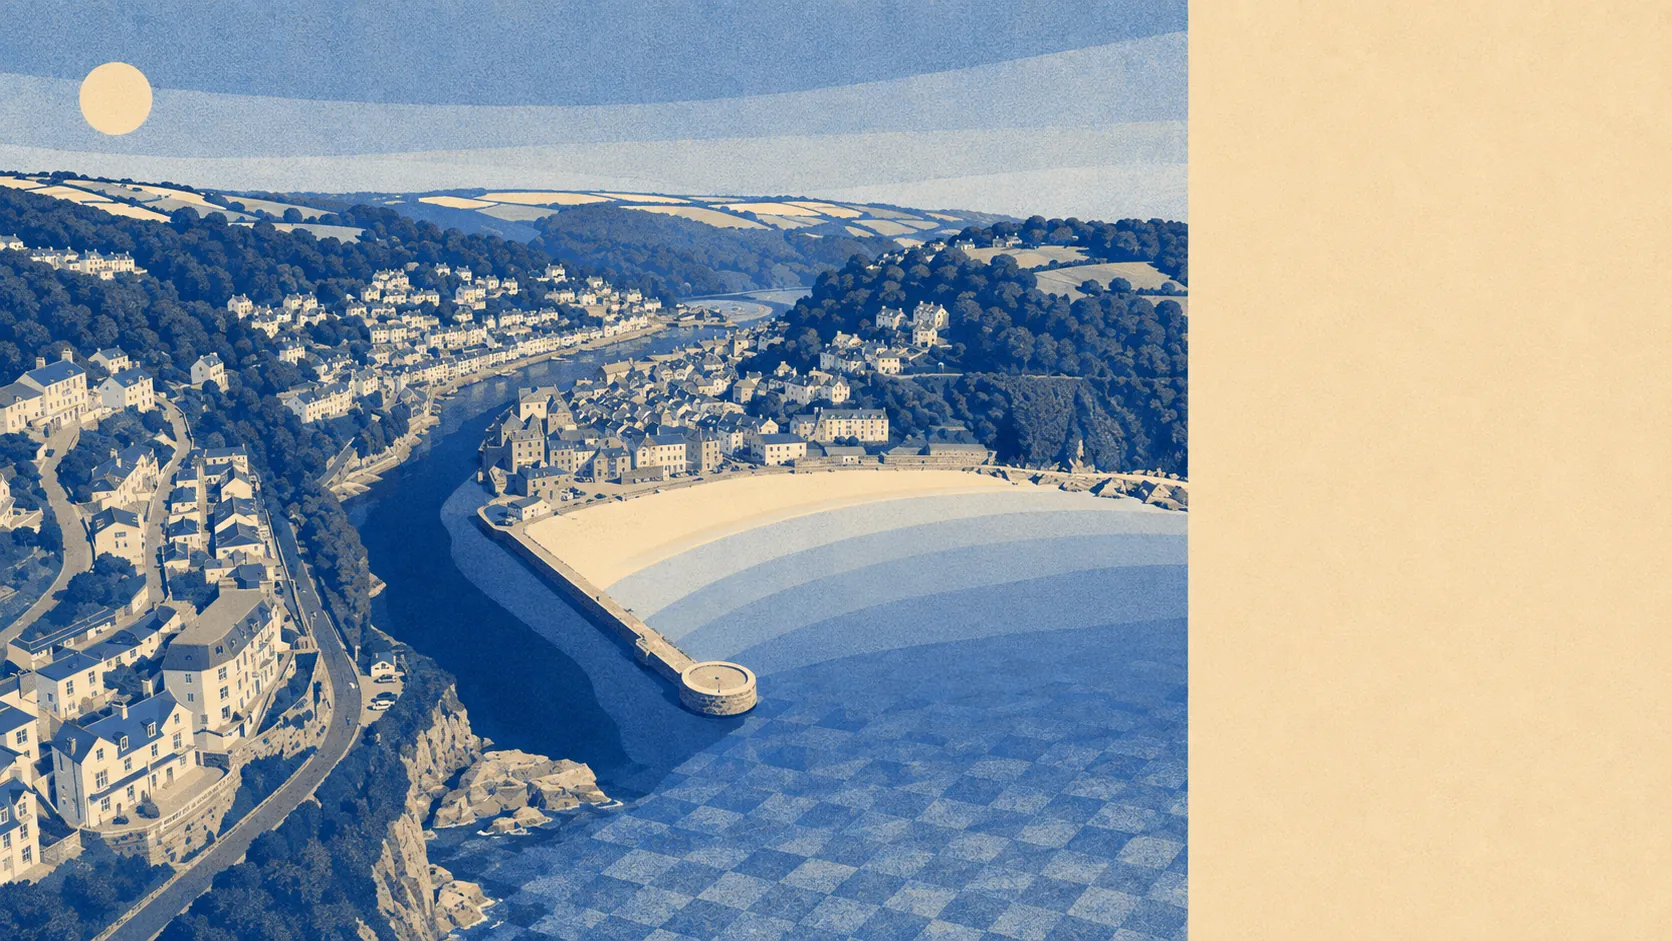
Yes, and not marginally. A town built where a river meets the sea has been negotiating with the water since before anyone thought to map it. Roughly one in seven postcodes sits in the highest river-and-sea flood zone. Almost every postcode in the town is within a few hundred metres of the coast. The recorded flood register runs to dozens of separate events. This is not a risk to discover after the survey comes back.
The Environment Agency's river-and-sea mapping puts 14% of the area's postcodes in flood zone 3, the highest-probability band, with under 1% in zone 2. Those two zones are separate bands rather than nested ones: zone 2 is the additional medium-probability fringe sitting outside zone 3, which is why it can legitimately be the smaller figure. A property in zone 3 is not in zone 2 as well, and anyone who tells you the numbers should add up has misread the map.
Surface water is a different hazard entirely and does not appear on those zone maps at all. It gets folded into the postcode-level indicators further down. What the record shows is a town with real history behind it: 42 flood events sit on the recorded register, the most recent in September 2025 and attributed to the sea, and around 7% of the area has flooded at some point in the past.
Looking forward, the Environment Agency's climate-change allowance widens the picture to 17% of postcodes, so the modelled zone grows rather than holds. That allowance is a planning assumption about a warmer future, not a prediction about next winter.
For insurance, this shapes the process rather than blocking it. Properties in a mapped high-risk band typically need a specific quote rather than a comparison-site guess, and the premium and excess are worth establishing before a solicitor is instructed rather than during the fortnight before exchange. Sellers rarely volunteer this. Ask for the previous owner's cover and any claims history.
At postcode level, folding in every indicator including surface water, 20% of Looe's postcodes rate high on at least one measure, 10% rate medium and 29% rate low. Those bands overlap with the zone figures above rather than adding to them: a postcode can appear in both counts. The two measures answer different questions and neither replaces the other.
The count of homes lands harder than the shares. Across the postcodes that carry any risk at all, and only those appear in this count, the Environment Agency's rivers-and-sea mapping identifies 1,252 properties, of which 613 sit at high risk, 40 at medium and 38 at low. Of the high-risk properties, 241 are residential. That is a substantial part of the town's housing rather than a handful of quayside cottages.
On defences, the modelled extents give an uncomfortable answer. The share of postcodes falling inside the high flood extent is 13% whether the model counts defences as present or not. Defended in this context means a defence exists in the model, nothing more. It is not a statement that the water stops there, and it should not be read as one.
The geography explains most of it. Around 94% of postcodes lie within 500 metres of the coast, the closest sitting 10 metres from it, and the typical postcode around 163 metres away. That 500-metre threshold is how the data is defined rather than a claim about any individual address, but in a town this shape it is close to a description of everywhere.
The shoreline management policy for Looe is hold the line across the twenty, fifty and hundred-year horizons. That is a stated intention to maintain defences over those periods. It is not a guarantee, it is not funded infrastructure that already exists, and policies have been revised before. At the nearest tide gauge, at Devonport, the record from 1962 to 2015 shows sea level rising at 2.35 millimetres a year. That is a measured historic rate over the length of that record, not a forecast.
Flooding is the weakest part of the case for living in Looe, and the town has never pretended otherwise. Buy here with the map open, the quote in hand and the ground floor understood, or buy somewhere the water has less to say.