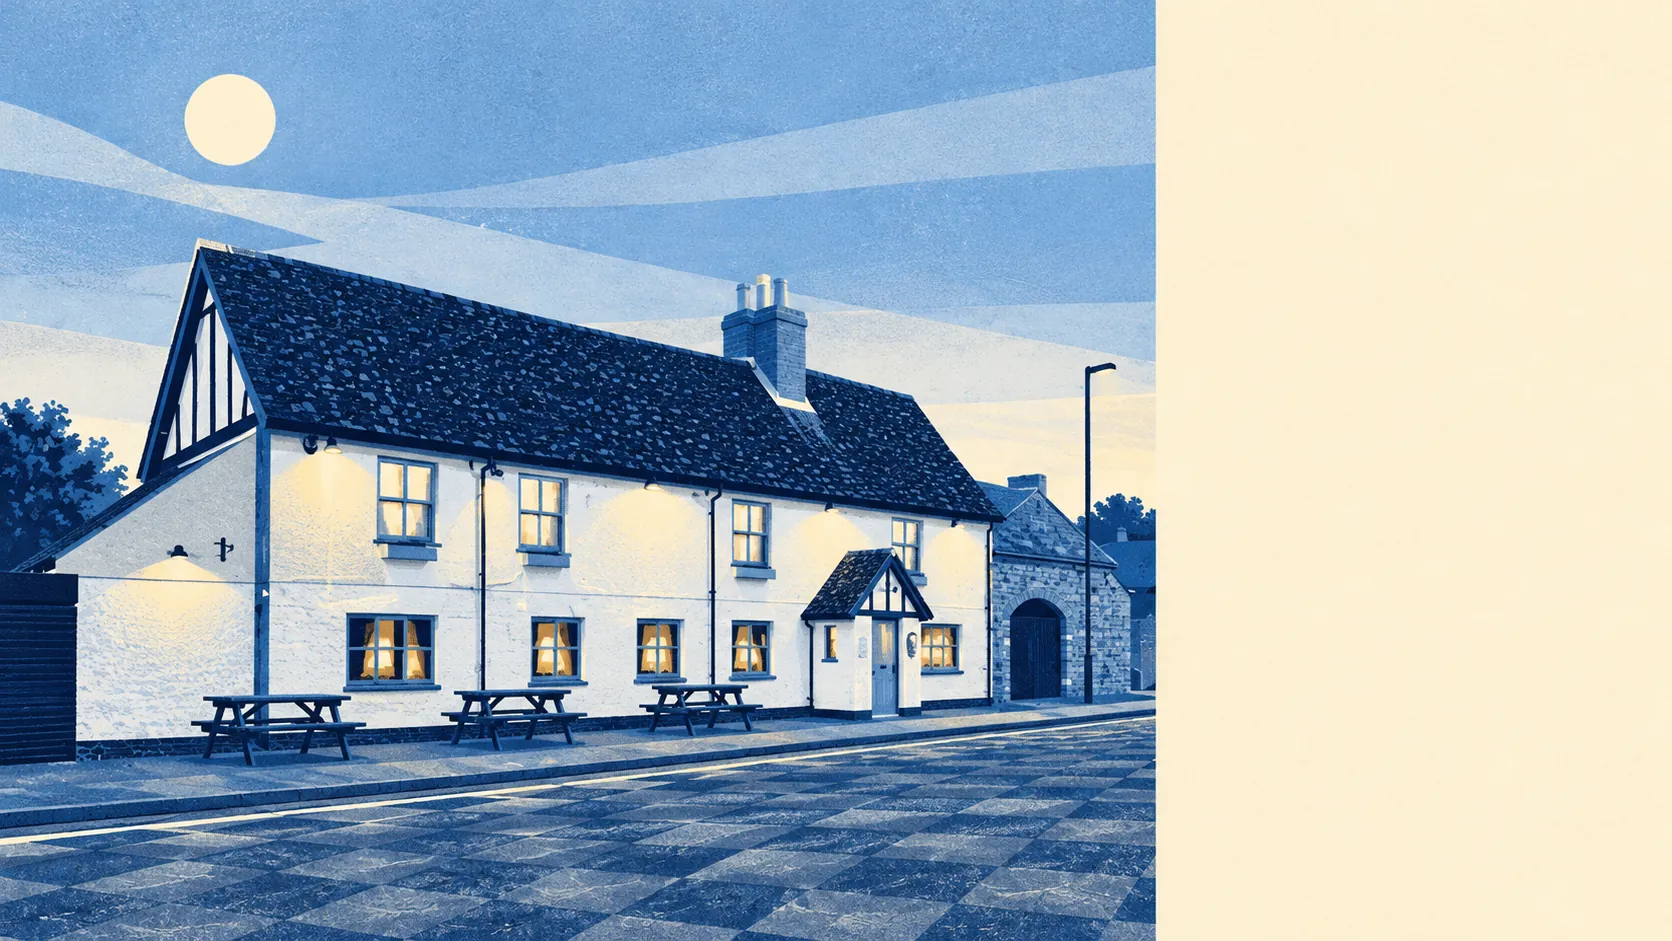
Clapham, Bedfordshire will let you extend a post-war semi without a heritage officer looking over the fence, and then makes you think hard about where the rain goes. There are four listed buildings and no conservation area. About a third of the postcodes carry a high flood flag of some kind. The planners are relaxed here, and the water is less so.
Most villages near a county town come with a church, a green and a committee that gets a say in your window frames. Historic England lists four buildings in the Clapham area: one at Grade I and three at Grade II. The area has no conservation area and no scheduled monument. For almost every homeowner, a loft conversion or a side extension goes through the ordinary planning system, with no extra heritage layer on top. Listed building consent is a problem for the owners of four buildings, and the odds are heavily against you having bought one of them.
Flood risk is where the picture changes, and it depends which measure is in front of you. On the broadest one, about 34% of Clapham's postcodes are rated high risk on at least one flood indicator, surface water included. About 43% reach medium on at least one, and about 69% carry at least a low flag. The Environment Agency's river-and-sea flood zones look much smaller: about 7% in zone 2 and 1% in zone 3, rising to about 11% once the agency adds its allowance for climate change. Counted by property, the agency puts five homes and businesses at high risk from rivers and the sea, and five more at medium. It has 36 recorded flood events for the area, the latest dated 1998. The gap between those two sets of numbers is the part a riverside sales pitch never mentions.
On crime, Bedfordshire Police's published figures put Clapham at about 58 recorded crimes per 1,000 residents in the year to May 2026. That is roughly 40% below the Bedford average of 97. Criminal damage and arson make up about 30% of the local total, against about 7% across England and Wales. The total is small, though, and a handful of incidents can move a share like that by several points, so it says little about what the next year will look like.
Two stations carry the Bedford name, Bedford Rail Station and Bedford St Johns, and about 1% of working residents take a train to work. About 56% drive and about 29% work from home. The bus network has 23 stops, and the 15 with timetable data average about 14 weekday departures each, or about two in the peak hour. About 87% of those stops have a weekend service too. The Department for Transport's modelling, done in 2019, put Bedford town centre about 24 minutes away by public transport and 15 by car. Bus figures age as routes get cut, so the car time is the safer of the two. Broadband is the strong point: gigabit-capable connections reach about 82% of premises and superfast about 97%. The village is better connected to the internet than to the train it has two stations for.
About 75% of households own their home, and the typical resident is 43. The Office for National Statistics models gross household income for the wider area at about £64,000 a year, for the financial year to March 2023. That is a before-tax figure covering a larger block than the village. Taken together, the numbers describe a place where people buy, settle into the mortgage and stay put. Nobody moves here for the nightlife, and nobody has asked for any.
The Land Registry recorded 51 sales in the year to April 2026, at a median of £290,000. Semi-detached houses were the bulk of the market, with 24 sales at a median of about £295,000. Fifteen terraces went for about £260,000, eight detached houses for about £624,000 and four flats for about £185,000. Band C is the most common council tax band, and bands A and B together cover about 34% of homes. In this village the semi more or less sets the price for everything else.
For renters, Bedford borough's typical private rent is about £1,170 a month as of April 2026. That figure covers the whole borough and is not a Clapham figure.
The council tax list counts every home, and on it the semis lead at about 35%. Terraces make up about 20%, detached houses about 16%, bungalows about 12% and flats about 10%. Only about 11% were built before 1930. The energy certificates are middling: about 55% of certified homes are rated A to C, about 36% D and about 9% E or worse. About 80% of homes heat with mains gas. Hardly anything here is old enough to make a conservation officer flinch, so the extension you want will usually go onto a house nobody will ever list.
Green space is close. The average home is roughly 120 metres from the nearest green space, with about 12 within a kilometre, and water is about 300 metres away. This page also covers Milton Ernest and Oakley, both further up the Great Ouse, where the river is the main attraction. It is the same water the flood maps are drawn around.
Clapham is right for a family that wants a semi it can grow sideways, drives to work and wants to stay out of a planning committee's diary. Anyone who needs a train every morning, or who wants a home with any period character, will find better elsewhere.
On balance Clapham is an above-average place to live. Owners can build almost whatever the ordinary planning rules allow, and the biggest unknown about any house is how its plot deals with water. Buyers who want room to grow, and can live with that one question, get a good deal.