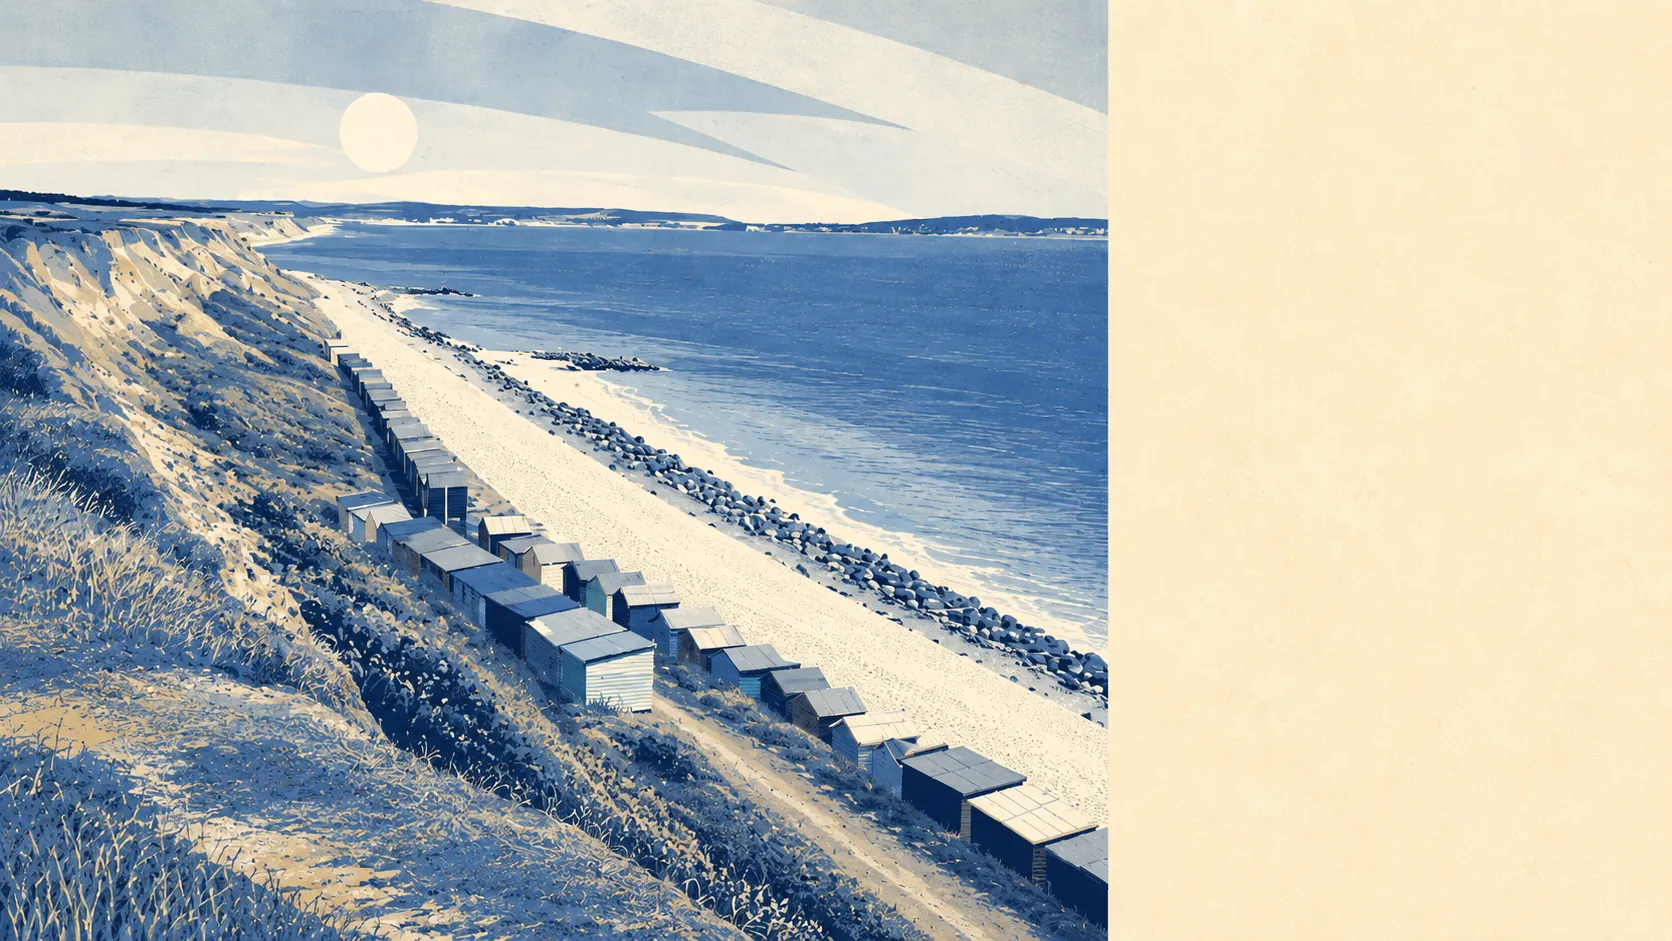
Barely, and not in the way a cliff-top village on the Channel might suggest. Almost nothing here sits inside the river-and-sea flood zones. One flood event appears in the whole recorded history of the area. The village is perched on top of a cliff, which is an excellent flood defence and a poor long-term plan. The water is not coming up to meet Barton on Sea. Barton on Sea is going down to meet the water.
Start with the formal picture. Across the area's 240 postcodes, about 0.4% fall inside the Environment Agency's flood zone 2, and none at all fall inside zone 3. Those two are exclusive bands rather than nested ones: zone 3 is the higher-probability core, and zone 2 is the additional medium-probability fringe sitting beyond it. So the entirety of the river-and-sea exposure here is fringe, and there is not much of that.
Those zones only describe rivers and the sea. Surface water, the kind that arrives off a road or out of an overwhelmed drain, is measured through a separate set of postcode indicators, and it is the measure worth reading in a place like this. The single recorded flood event on file came from an ordinary watercourse in December 1993, and about 0.4% of postcodes carry a historic flood record.
Look forward and the numbers move slightly. With the climate allowance applied, the share of postcodes falling inside a flood zone rises to roughly 0.8%. Still small. Still a fringe.
For insurance, that shape matters more than the headline. An address outside any modelled extent should be underwritten on ordinary terms and asked ordinary questions. An address inside one of the flagged postcodes will be asked about flood history at quotation stage, and the answer will affect both the premium and the excess. The practical move is to get an indicative quote on the specific address before instructing a solicitor, not after the survey comes back.
Broaden the measure and the figures get bigger, because a wider net catches more. Rating each postcode on at least one flood indicator, rivers, sea and surface water together, about 7% come out high, roughly 10% medium and about 28% low. Those bands overlap the zone figures rather than stacking on top of them, so they should never be added together.
Counted as homes rather than postcodes, the Environment Agency's rivers-and-sea mapping lists 186 properties across the nine postcodes that carry any risk at all. Nine of those properties sit at high risk, of which eight are residential, with five at medium and seven at low. Postcodes with no risk do not appear in that dataset, which is why the list is short.
On whether anything stands between the water and the house: no postcode here sits inside a modelled high-probability flood extent, with or without a defence present in the model. About 0.4% sit inside a low-probability extent with no defence modelled. Where the word defended does appear in this dataset, it means only that a structure exists in the model. It is not a statement that the property behind it is safe.
Proximity is the part that concentrates the mind. Around 36% of postcodes sit within 500 metres of the coast, a threshold the dataset defines rather than a judgement about any individual address. The closest postcode is roughly 112 metres from the water. The median across the whole area is about 659 metres.
Every postcode falls under a shoreline management plan, and the stated policy across the 20, 50 and 100 year horizons is the same: managed realignment. In plain terms, that is an intention to let the coastline move rather than hold it where it is. For a village that was the first place in England to try rock groynes, and which has spent decades installing revetments and drainage against cliff erosion, the official long-range answer amounts to letting the sea have its way on a managed schedule. A policy is an intention, not a defence that already exists, and certainly not a guarantee.
The nearest long-record tide gauge is at Portsmouth, where the measured rise across the 1962 to 2023 record works out at about 2 millimetres a year. That is a historic rate off an instrument, not a projection.
Flooding is not the thing to worry about here, but this is not a clean bill either. Barton on Sea comes out middling on water risk: the flooding itself is small and confined to a handful of postcodes, while the coastline the village stands on is an open question with a policy attached rather than a wall.