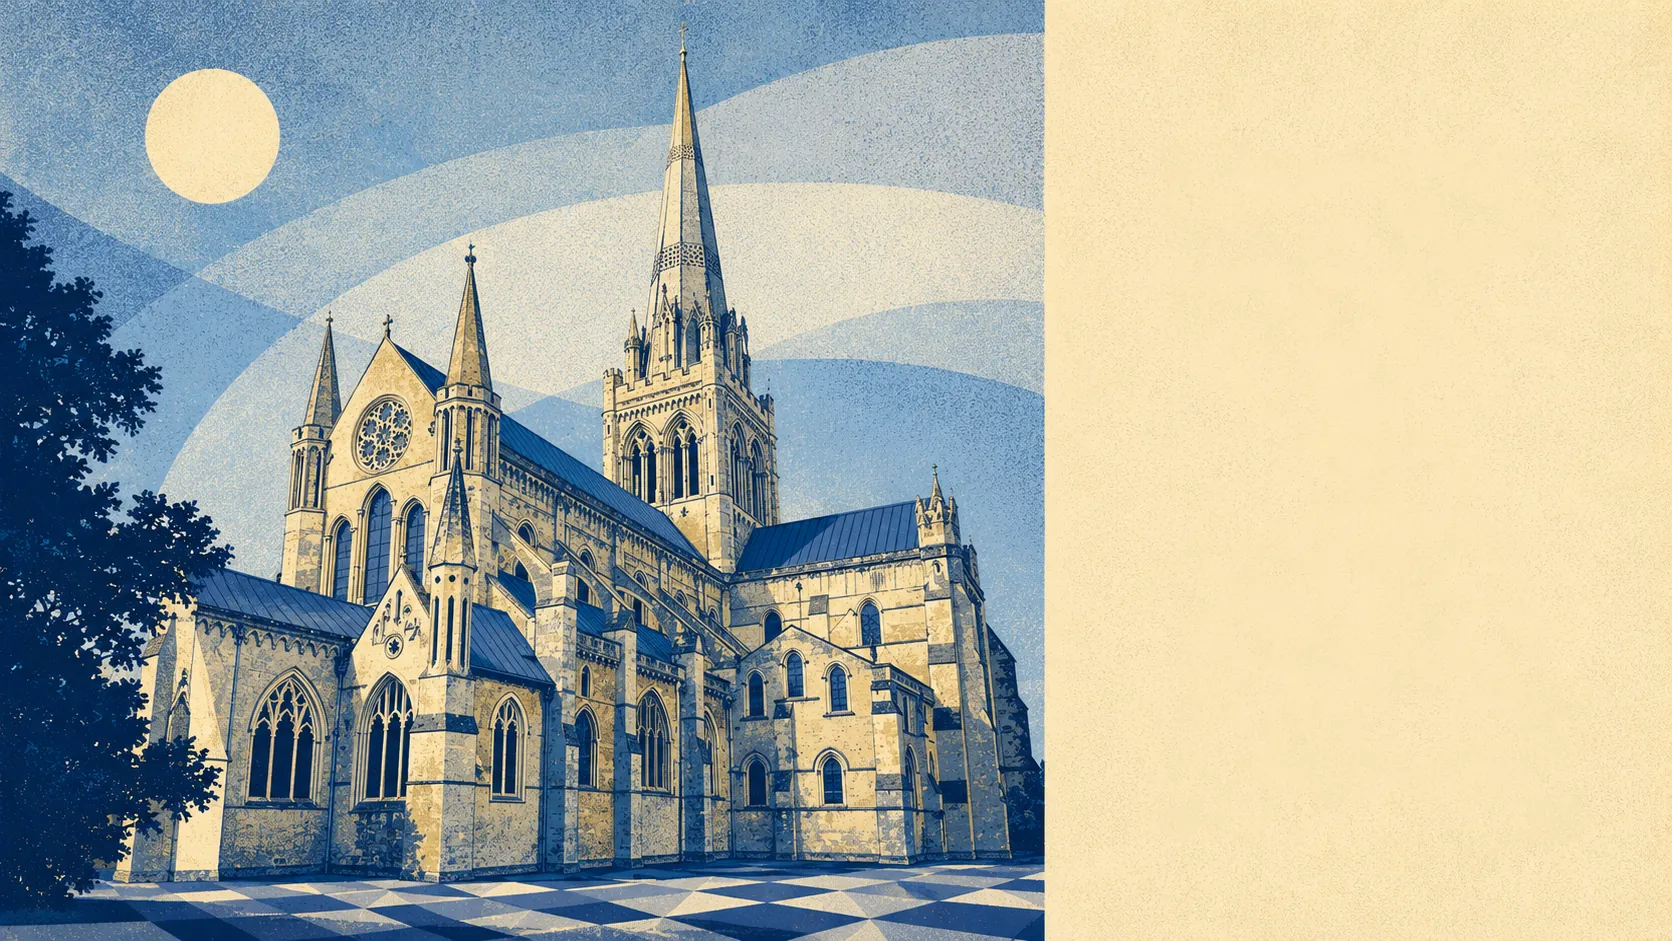
Older, settled, and a lot of them on their own. The median age is forty-two. The typical household income runs at about £58,000 a year. More than a third of homes are occupied by one person. Roughly one in five is a pensioner living alone. A cathedral-city demographic that leans older and quieter than the city size would suggest.
Tenure splits about fifty-five to forty-five between owners and renters. Around fifty-five per cent of households own their home outright or on a mortgage. The remaining forty-five per cent rent, in roughly equal shares between the private market and social or housing-association stock. That is more renting than the rural postcodes outside the city carry and less than the south-coast cities to the west, which puts the cathedral postcode in the middle of the tenure spectrum for the region. The owner-occupier core is older and settled. The private-rental fringe is younger and more mobile, and it is where the working-age residents tend to live while they save for a mortgage that pays for a Chichester postcode.
The age profile leans older. The median resident is forty-two, which is meaningfully above the national figure and above most of the south-coast cities the cathedral city gets compared to. The working-age twenty-five-to-forty-four share lands at about a quarter of the population, which is lower than a comparable cathedral postcode might carry if there were more affordable housing in the centre. The other side of the age curve is where Chichester carries its weight: a substantial share of single-pensioner households and a longer tail of older residents who have either retired here or never left.
Household income reads as the financial counterpart of the age profile. The typical household earns around £58,000 a year, with the net household figure landing closer to £43,000. That is above the south-coast median and below the central-London one, which is where a cathedral postcode in the home counties tends to sit on the income map. About two in five working-age residents hold a degree-level qualification. The unemployment rate runs at about two per cent. Just under three in ten residents work from home. The story is one of professionals, public-sector workers, retired residents drawing pensions, and a tail of self-employed and small-business operators.
Household composition runs heavily toward single occupants. About thirty-six per cent of households are one person living alone, and roughly nineteen per cent are pensioners doing so. Couples with dependent children make up about fifteen per cent. Lone-parent households another ten per cent. The remaining quarter splits between couples without children, multi-adult shared households, and the various combinations that do not fit a category. Chichester is not a family-dominated postcode; the household pattern reads as a settled town with a strong solo-living share and a steady retired demographic.
So: middle-of-the-pack on the deprivation index, drifting slightly worse year on year, with a household profile that is older, more single-occupant and better-off than the average cathedral-city stereotype carries. The people who live here are mostly people who can afford to live here. The people who can afford to live here are mostly the people who already do.